Software Reference 111
P/N CLS151164 Rev. B LabChip GX Touch/GXII Touch User Manual PerkinElmer, Inc.
Graph Settings
To change the settings for the graph displayed in the Egram/Gel
Tab or the EGram Tab, select the Graph Settings check box on the
right side of the EGram Tab.
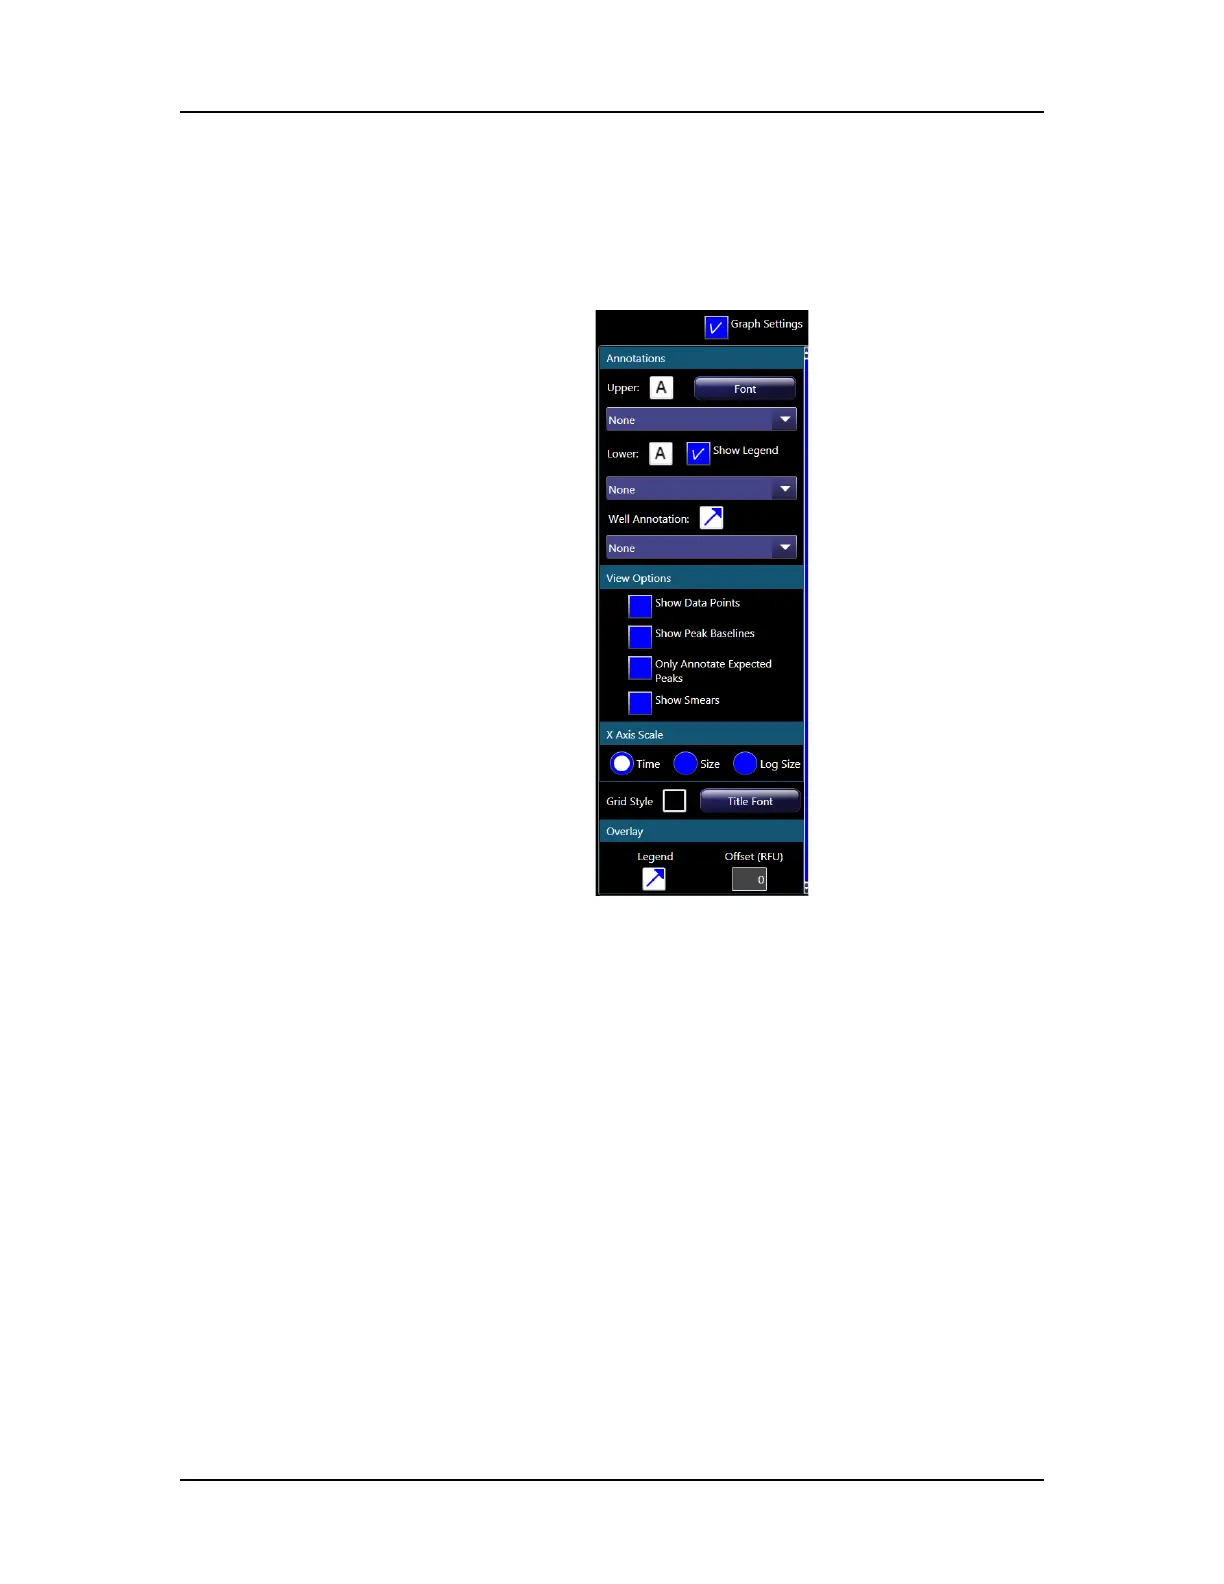
Figure 43. Graph Settings
The graph settings contain the following options:
Annotations
• Text Orientation (A) buttons - Specifies the orientation of the
text for the upper or lower annotation: horizontal, vertical up, or
vertical down.
• Font button - Opens the Font window to choose the font, style,
and size of the text for the upper or lower annotations.
• Upper drop-down list - Labels each peak in the graph with the
peak property selected from the drop-down list. Default is Type.
• Show Legend check box - If selected, the annotations legend
displays in the upper left corner of the graph.
• Lower drop-down list - Labels each peak in the graph with a
peak property selected from the drop-down list. Default is None.
 Loading...