Viewing the Data 51
P/N CLS151164 Rev. B LabChip GX Touch/GXII Touch User Manual PerkinElmer, Inc.
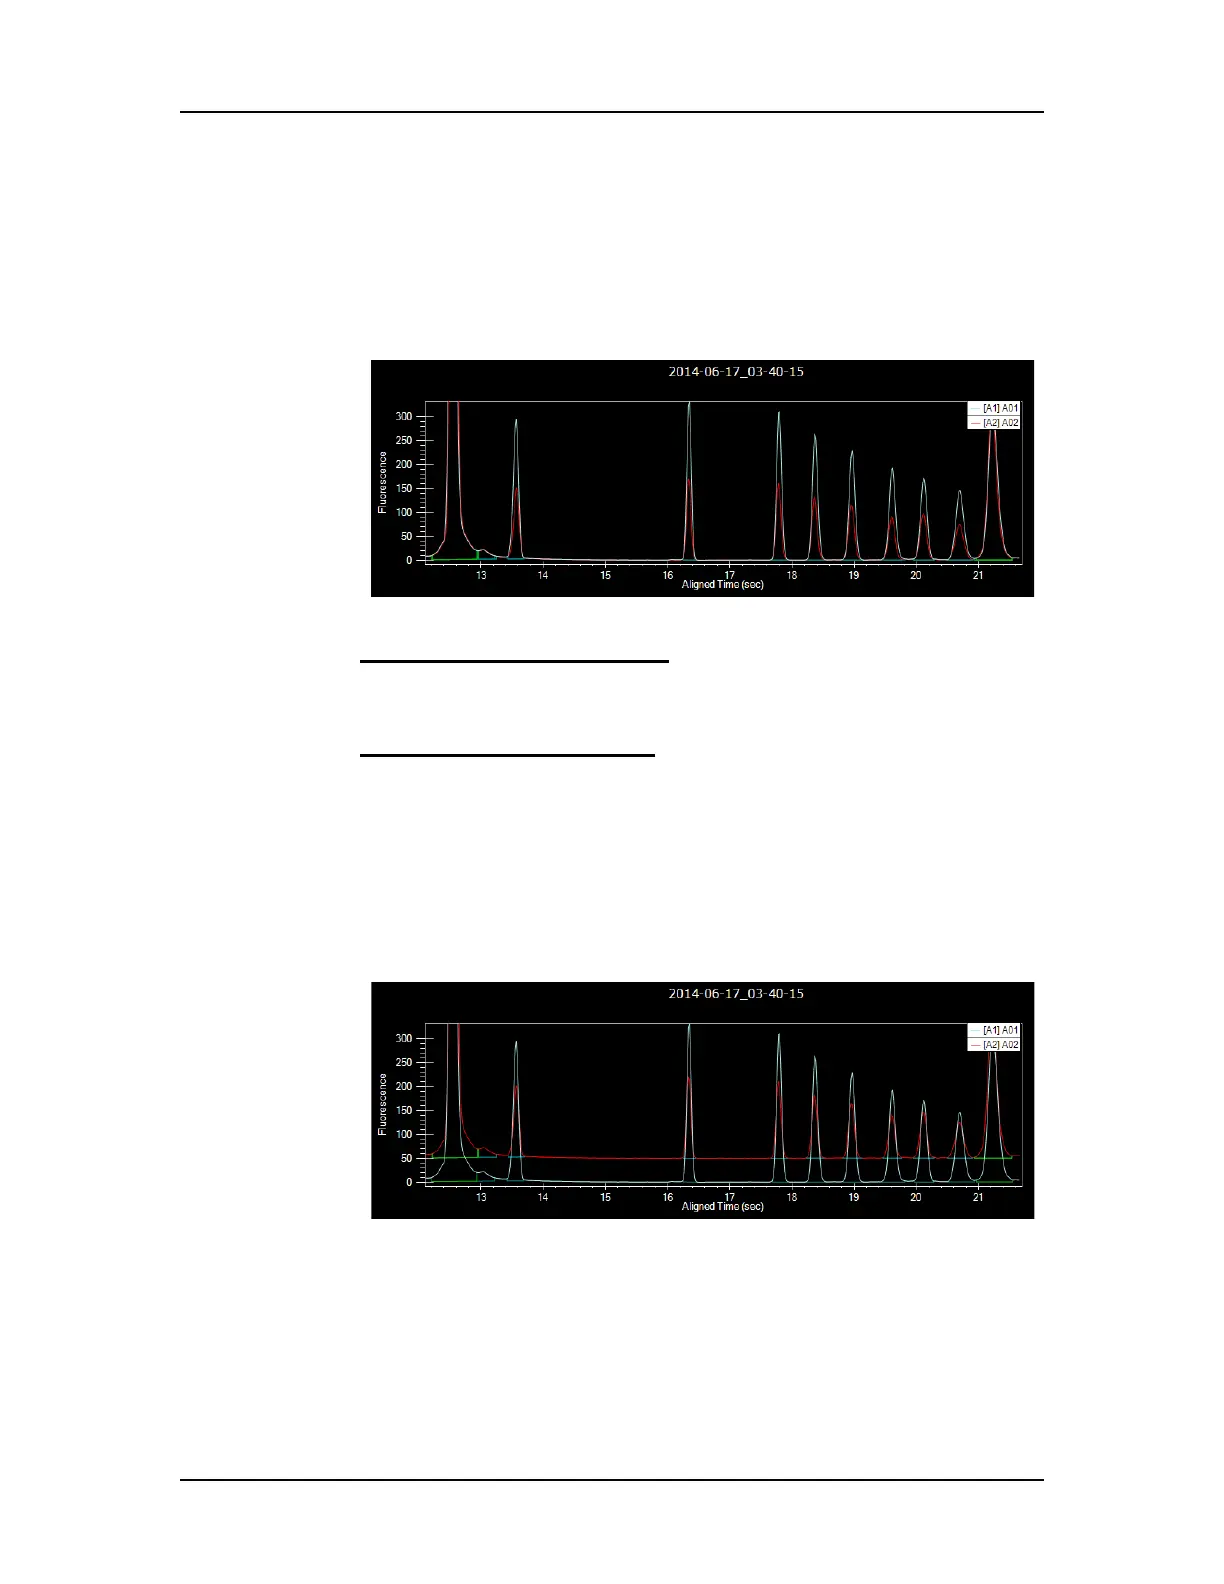
Graph Overlay
The graph in the Egram/Gel Tab can display multiple wells overlaid
in the same graph for visual comparison. Each well is shown in a
different color and line style with a legend at the top of the window.
Figure 10 shows the electropherograms of two wells in the same
graph.
Figure 10. Graph with Multiple wells
To remove a specific sample
from the graph, touch the sample
that you want to remove in the Select Wells to View Tab or
Egram/Gel Tab.
To display only one sample
in the graph, clear the Overlay check
box and touch one sample in the Select Wells to View Tab or
Egram/Gel Tab.
Overlay Offset
Use the Overlay Offset text box on the Graph Settings to offset
each of the graphs by the RFU value specified. Figure 11 shows the
electropherograms of two wells in the same graph, offset by 50
RFU.
Figure 11. Overlay Offset
 Loading...