MULTI GAUGE CONTROLLER OPERATION
3.4.2 CHART WINDOW
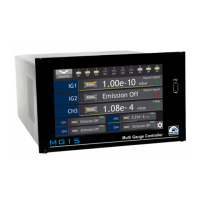
The additional window contains a chart module. The module is used to visualise graphically the
behaviour of a chosen physical quantity in time. In the further part of the manual a single physical
quantity in time will be called data series.
The time axis is scaled in minutes for the time of recording of charts up to one hour. Above one hour
the time axis is scaled in hours.
The charts module in some devices is available optionally at an additional
charge. The user may order the device with an activated charts module or acti-
vate it later - refer to chapter 3.4.2.7
Figure 3.12: Chart module
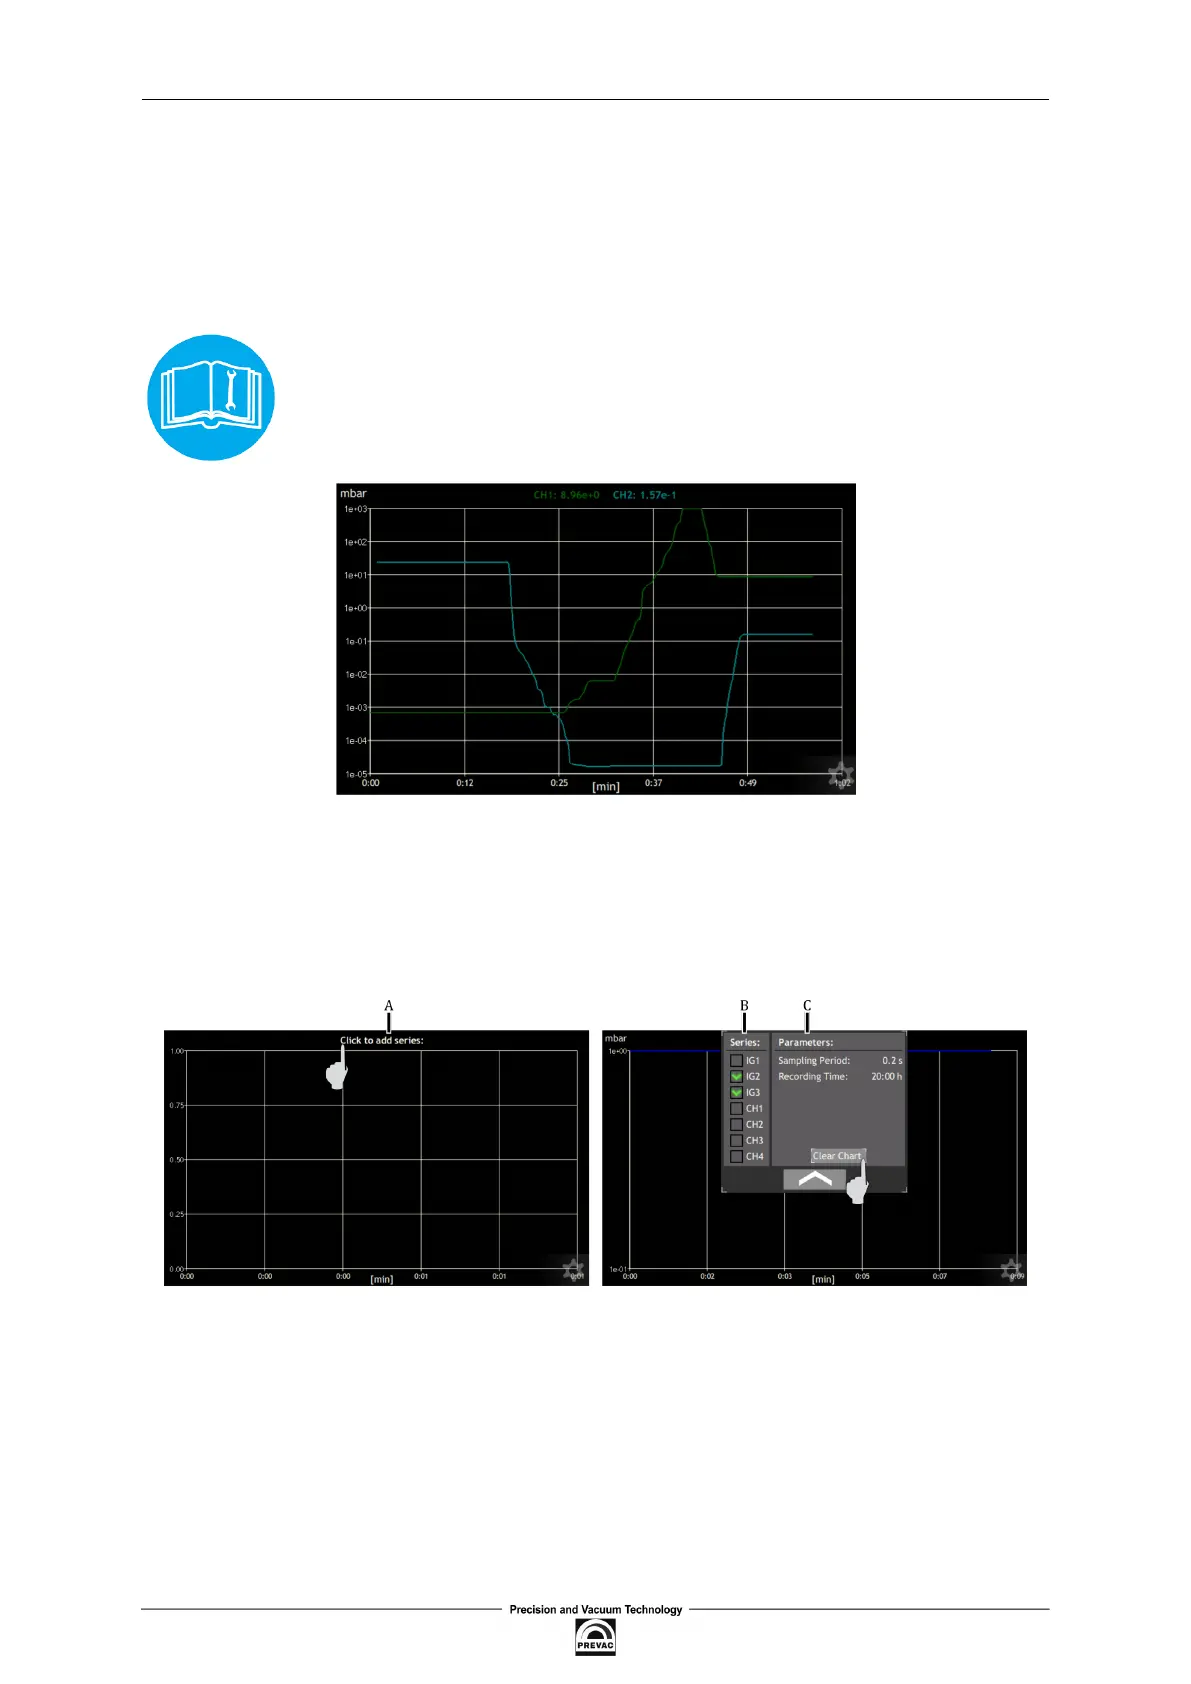
3.4.2.1 ADDING OF DATA SERIES
To add or remove data series follow the procedure presented in ig. 3.13:
Figure 3.13: Adding data series and editing chart parameters
• A - Click on top ield, with currently drawn data series
• B - Deine the data series to be drawn
User manual rev. 03 Page 39