Instrument functions
R&S
®
LCX Series
89User Manual 1179.2260.02 ─ 02
b) In the "Data Source" list, select the parameter, e.g. "Impedance (Z)".
c) Select a color for the parameter trace.
d) To show the minimum and maximum readings of the selected parameter, turn
"Show Min/Max".
e)
To show the trace, turn "Enable".
f) Confirm with "Apply".
4. Repeat step 3 to assign additional traces, e.g. to display the readings of the reac-
tance and phase angle.
5. Select "Clear" to restart the trace display.
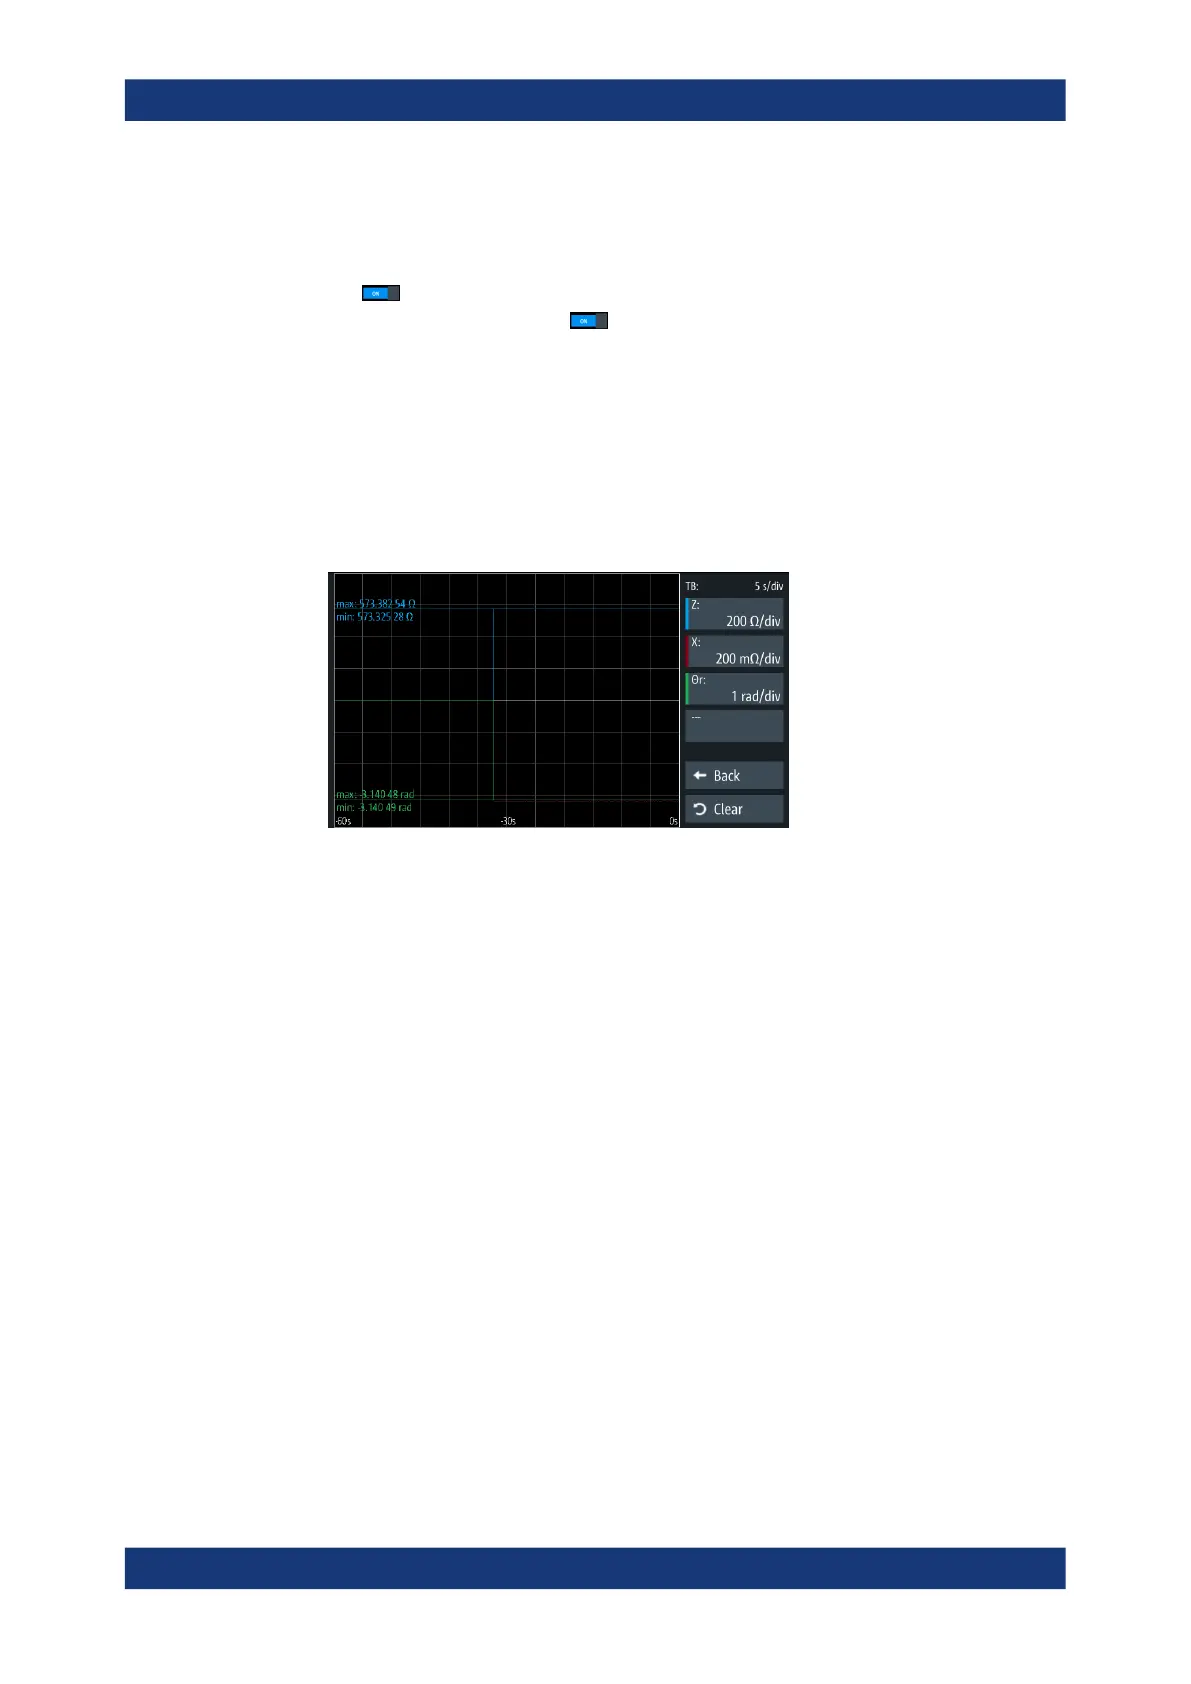
The graph shows the traces of the measured values for the selected parameters. If
enabled, the chart assigns the measured minimum and maximum readings to the
trace of the parameter and displays the values numerically.
Figure 8-13: Graphical display of a resistance measurement
8.8.2
Logging chart viewer
The logging chart viewer function enables you to display recorded measurement data
graphically and to evaluate and validate the results. You can view a previously recor-
ded measurement loaded from a file.
Access:
1. Press the [settings] key at the front panel.
Specific instrument functions
 Loading...


