Instrument functions
R&S
®
LCX Series
93User Manual 1179.2260.02 ─ 02
3. To configure a parameter for display:
a) Select a parameter softkey on the right of the display.
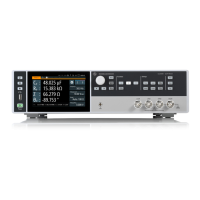
The "Configure Chart Trace <n>" dialog opens.
Figure 8-17: Configure chart trace dialog
b) In the "Data Source" list, select the measurement parameter, e.g. "Frequency".
c) Select a color for the parameter trace.
d)
To show the trace, turn "Enable".
e) Confirm with "Apply".
4. Repeat step 3 to assign additional traces.
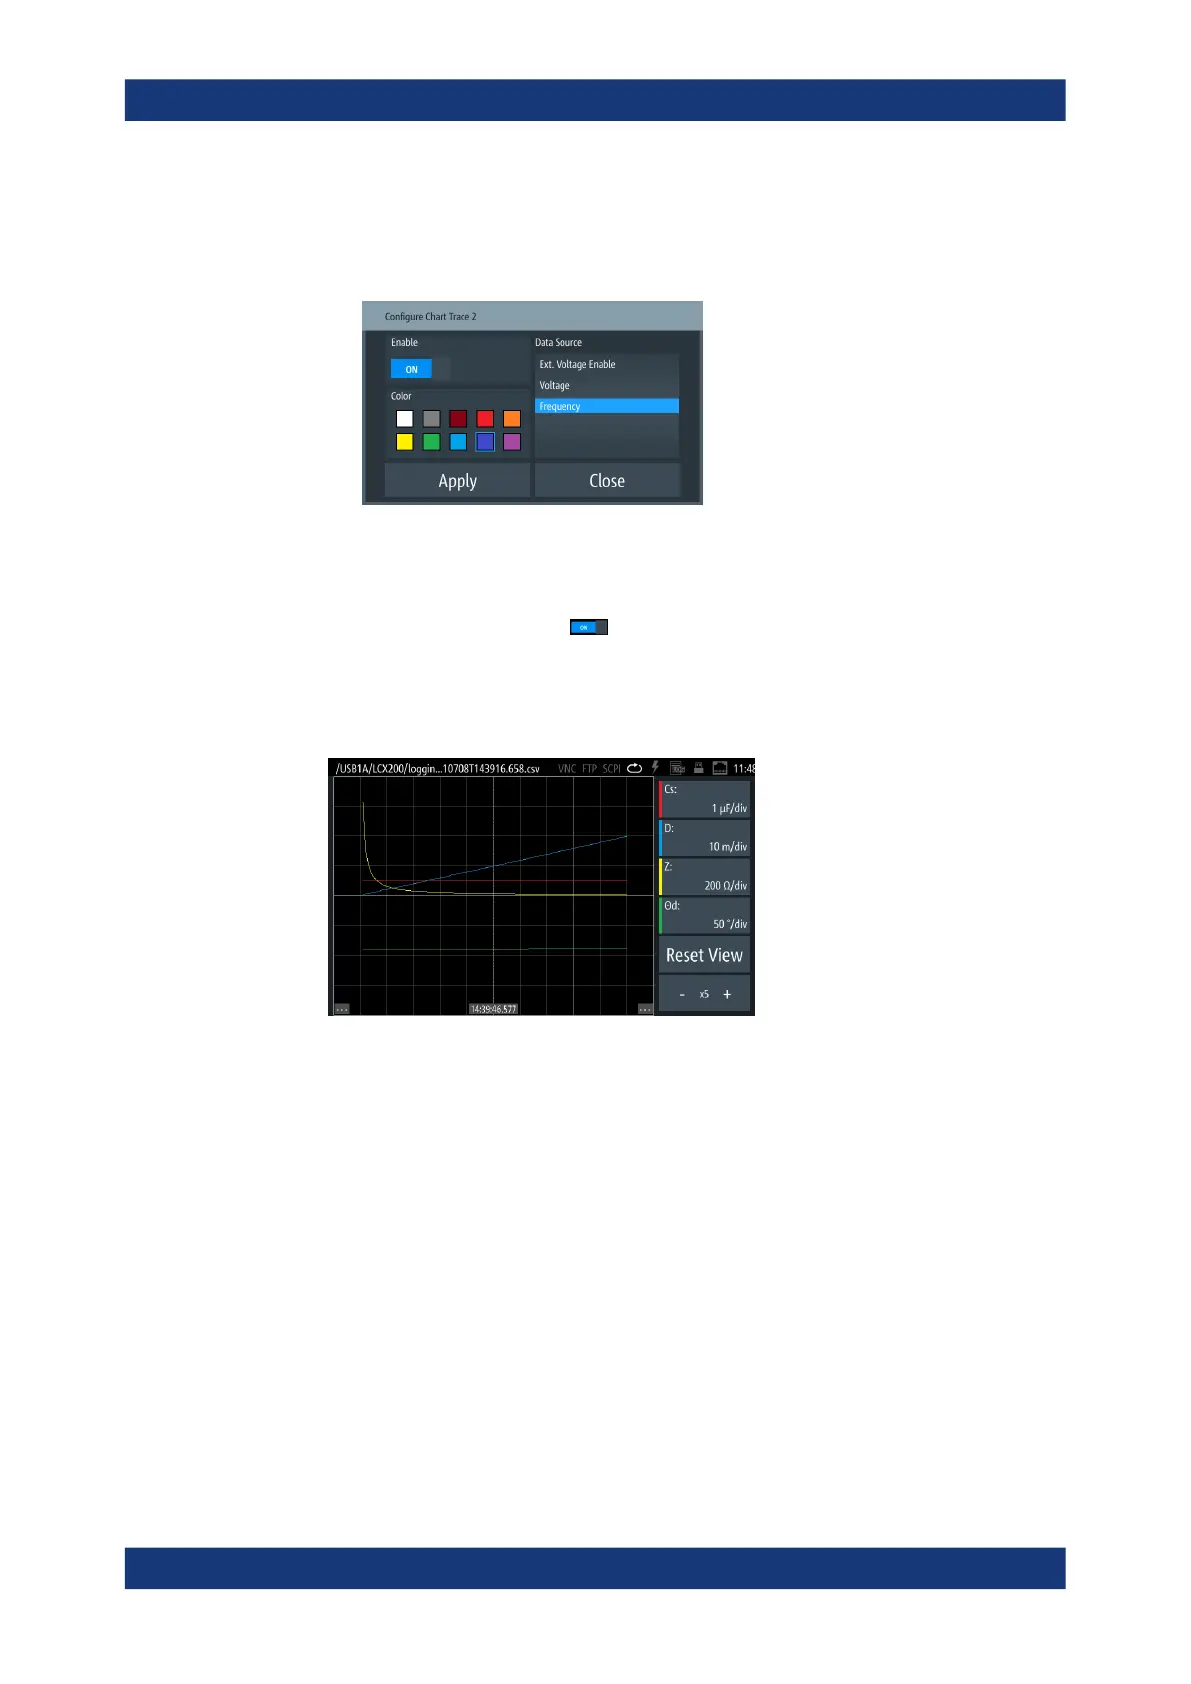
The R&S LCX displays the customized chart accordingly.
Figure 8-18: Customized log chart
5. To return to the initial view, select "Reset View".
Displaying the logging results in the chart viewer
To configure the logging chart view:
1. Press the [settings] key at the front panel.
2. In the "Functions" tab, select "Logging".
3. Select "Open Log Chart".
The R&S LCX opens a file selection dialog and prompts you to select a data log-
ging file.
a) Select a file to display.
b) Confirm your selection with "Select".
Specific instrument functions
 Loading...


