Page 54
11. Loops, Trends & Waveforms
This chapter details the way the ventilator displays
patient data. The ventilator displays the real time
data collected from the proximal airway pressure
transducer and ET manifold mounted flow sensor, to
provide Pressure, Flow and Tidal Volume
waveforms. The ventilator can also display Loops
based on the pressure, flow and volume data, plus it
can trend certain parameters against time.
The ventilator displays information in the following
ways.
WAVEFORMS
Pressure waveform
Flow waveform
Tidal volume waveform (Not available
in HFO+CMV mode)
LOOPS Flow Versus Volume loop (Not
available in HFO+CMV mode)
Flow Versus Pressure loop (Not
available in HFO & HFO+CMV mode)
Volume Versus Pressure loop (Not
available in HFO & HFO+CMV mode)
TRENDS Minute Volume against time
Max Pressure against time
Mean Pressure against time
Min Pressure against time
O
2
% against time
DCO
2
against time (Not available on
the SLE4000)
Resistance against time
Compliance against time
11.1 Waveforms
The ventilators default display as already mentioned
is the pressure, flow and tidal volume waveforms.
The waveforms appear in each window overlayed
by a grid which acts as a visual aid to measurement.
Within these windows and that of the Minute
Volume window the user will find the breath
detection threshold and all the alarm thresholds that
are user settable.
When changing the ventilatory parameters the axis
in the windows autoscale to best display the patient
data.
The ventilator displays the waveforms within each
window in real time. The generated waveforms will
slowly track across the window. The user can set all
the waveforms to be started in the same place by
setting the Waveform display sync to ON. (See
“Waveform Display Sync” on page 40).
This means that the waveforms remain static (they
do not creep from left to right) in the windows.
For interactive ventilatory modes the data is
enhanced by displaying the patient trigger in a
different colour.
To view the trigger point the ventilator colours the
first 200 milli seconds orange, after the patient effort
that has crossed the breath detection threshold.
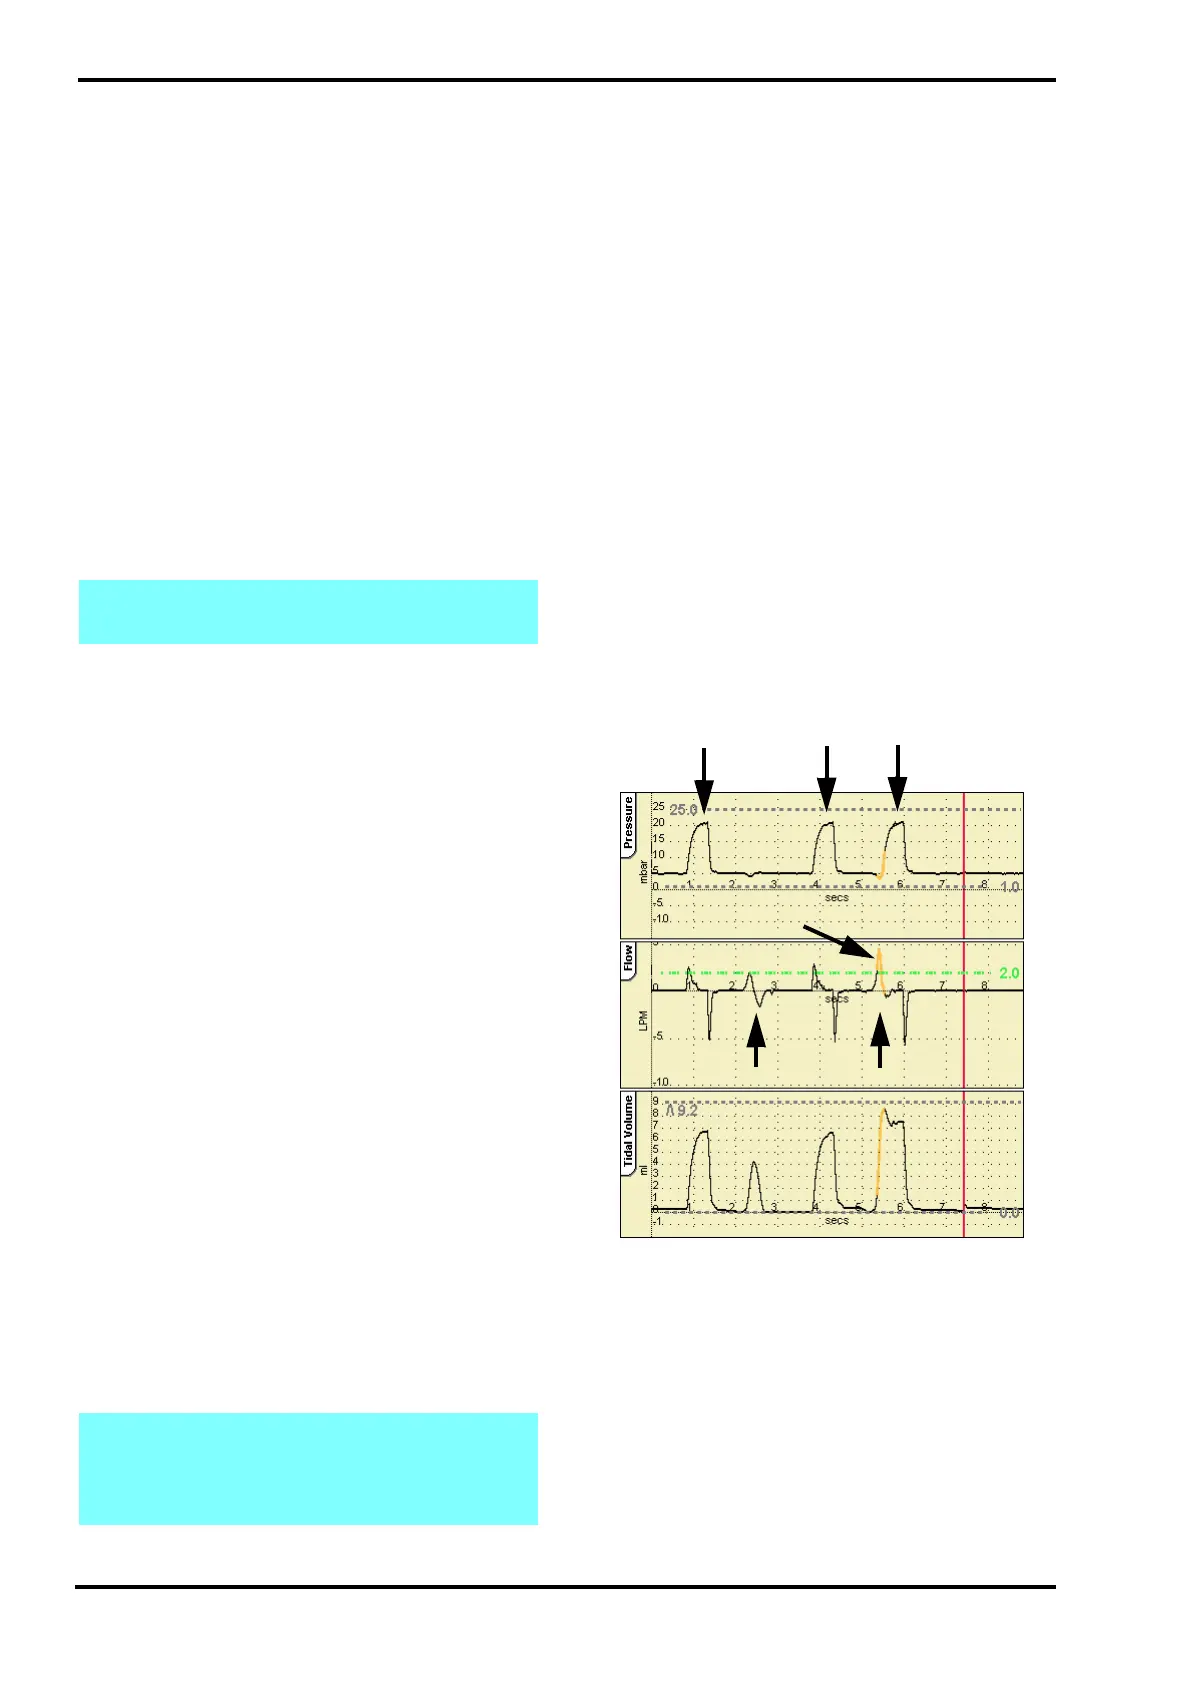
The illustration below shows the ventilator in SIMV
mode where the first patient breath did not cross the
breath detection threshold. The second patient
breath crosses the breath detection threshold and
the ventilator highlights the trigger point.
Note: The pressure waveform is always
displayed when showing a loop or trend.
Note: The user can display the pressure
waveform and the tidal volume waveform only
by selecting the Volume button in the Loops
and Waveform panel.
SIMV
Mandatory breaths
Patient attempt
below threshold
Patient attempt
crosses threshold
Triggered Breath
Trigger point