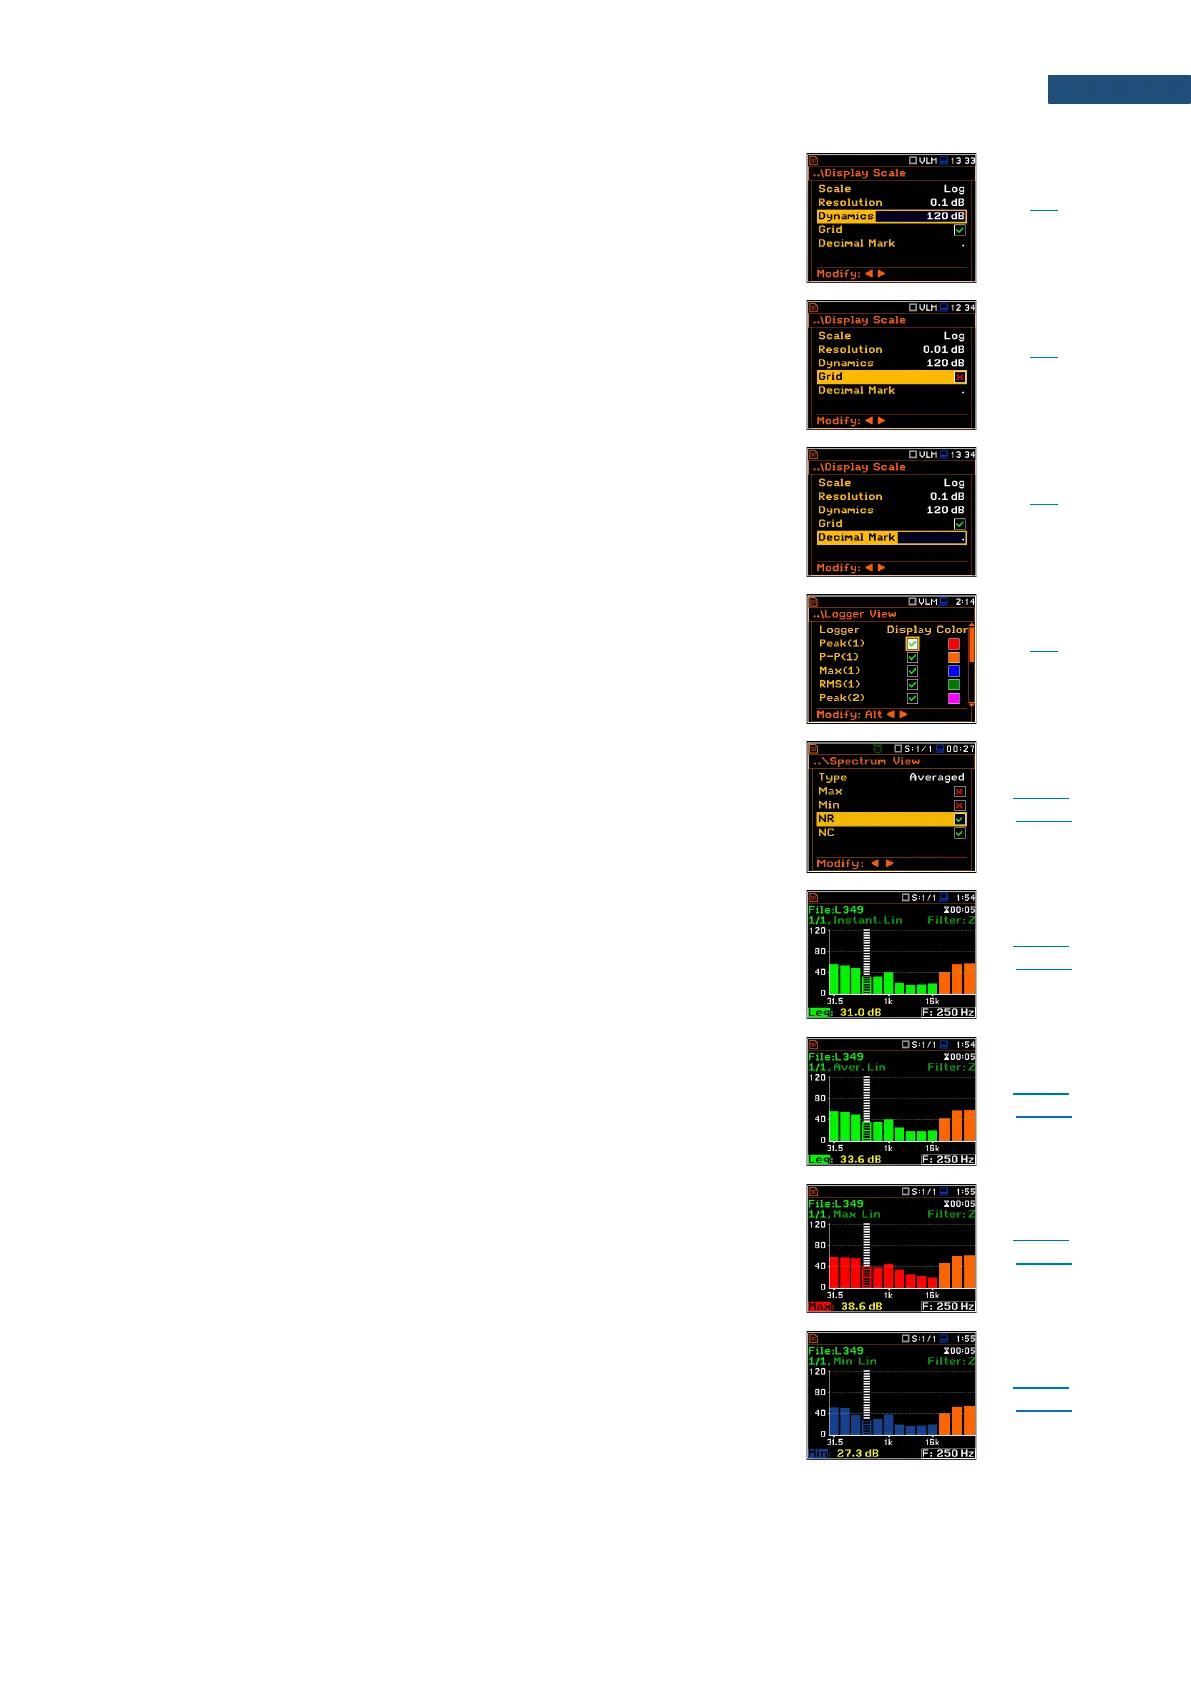
Range of the plot scale: 10dB, 20dB, 40dB, 80dB, 100dB
and 120dB.
Grid swither on or off during the time history or spectrum
presentation.
Parameter that defines which decimal mark (point or
comma) will be used for data presentation in all
presentation modes.
Screen that enables selecting of time-history results,
which will be presented on the display and colours of
their plots.
Screen that enables selecting of types of spectra for
displaying: Averaged, Instantaneous, Max, Min, NR and
NC.
Spectrum of instantaneous Leq results for the 1/1 octave
or 1/3 octave bands.
Spectrum of averaged Leq results for the 1/1 octave or
1/3 octave bands.
Spectrum of Max results for the 1/1 octave or 1/-octave
bands.
Spectrum of Min results for the 1/1 octave or 1/3 octave
bands.
 Loading...


