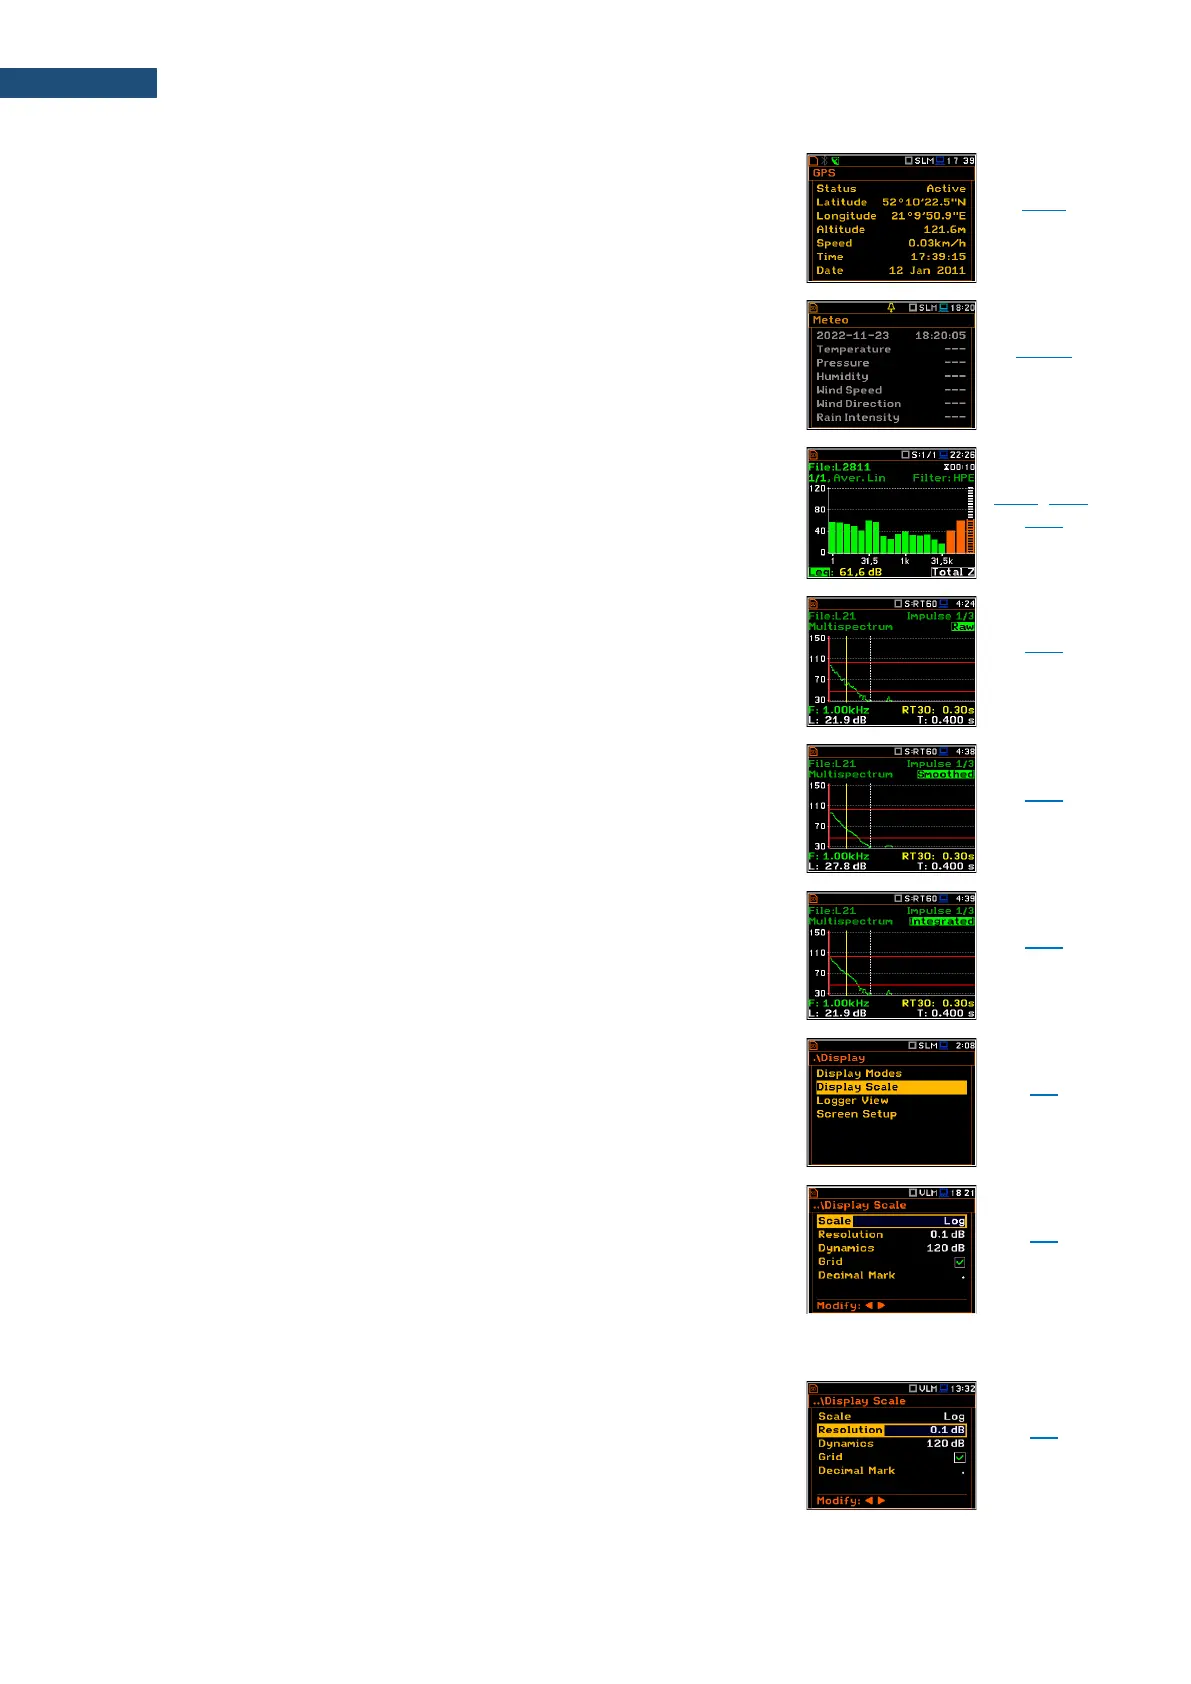
Presentation of GPS information: Status, Latitude,
Longitude, Altitude, Speed, Time and Date.
Presentation of results from weather station: ambient
temperature and pressure, humidity, wind speed, wind
direction and rain intensity.
Mode of presentation of different spectra: 1/1 Octave,
1/3 Octave and FFT.
Chapter
5.1.5, 10.3,
11.3
Presentation of decay curve of Leq results for 1/1 or 1/3
octave bands, integrated within Time Step interval.
Presentation of smoothed decay curve of Leq results for
1/1 or 1/3 octave bands.
Presentation of the integrated raw decay curve
(Schroeder curve).
Screen that enables setting parameters of results
presentation: Scale, Resolution, Dynamics, Grid and
Decimal Mark.
Scale and units of results presentation: linear (Lin) or
logarithmic (Log). In case of Lin, results are presented in
absolute units and the Y-scale of the time history or
spectrum plot is linear. In case of Log, results are
presented in logarithmic units (dB) and the Y-scale of the
time history or spectrum plot is logarithmic. Sound
measurement results are presented always in
logarithmic units (dB).
Number of digits after the decimal point of the results
presentation: one digit after the decimal point (0.1 dB) or
two digits after the decimal point (0.01 dB).
 Loading...


