6 Using the product
140
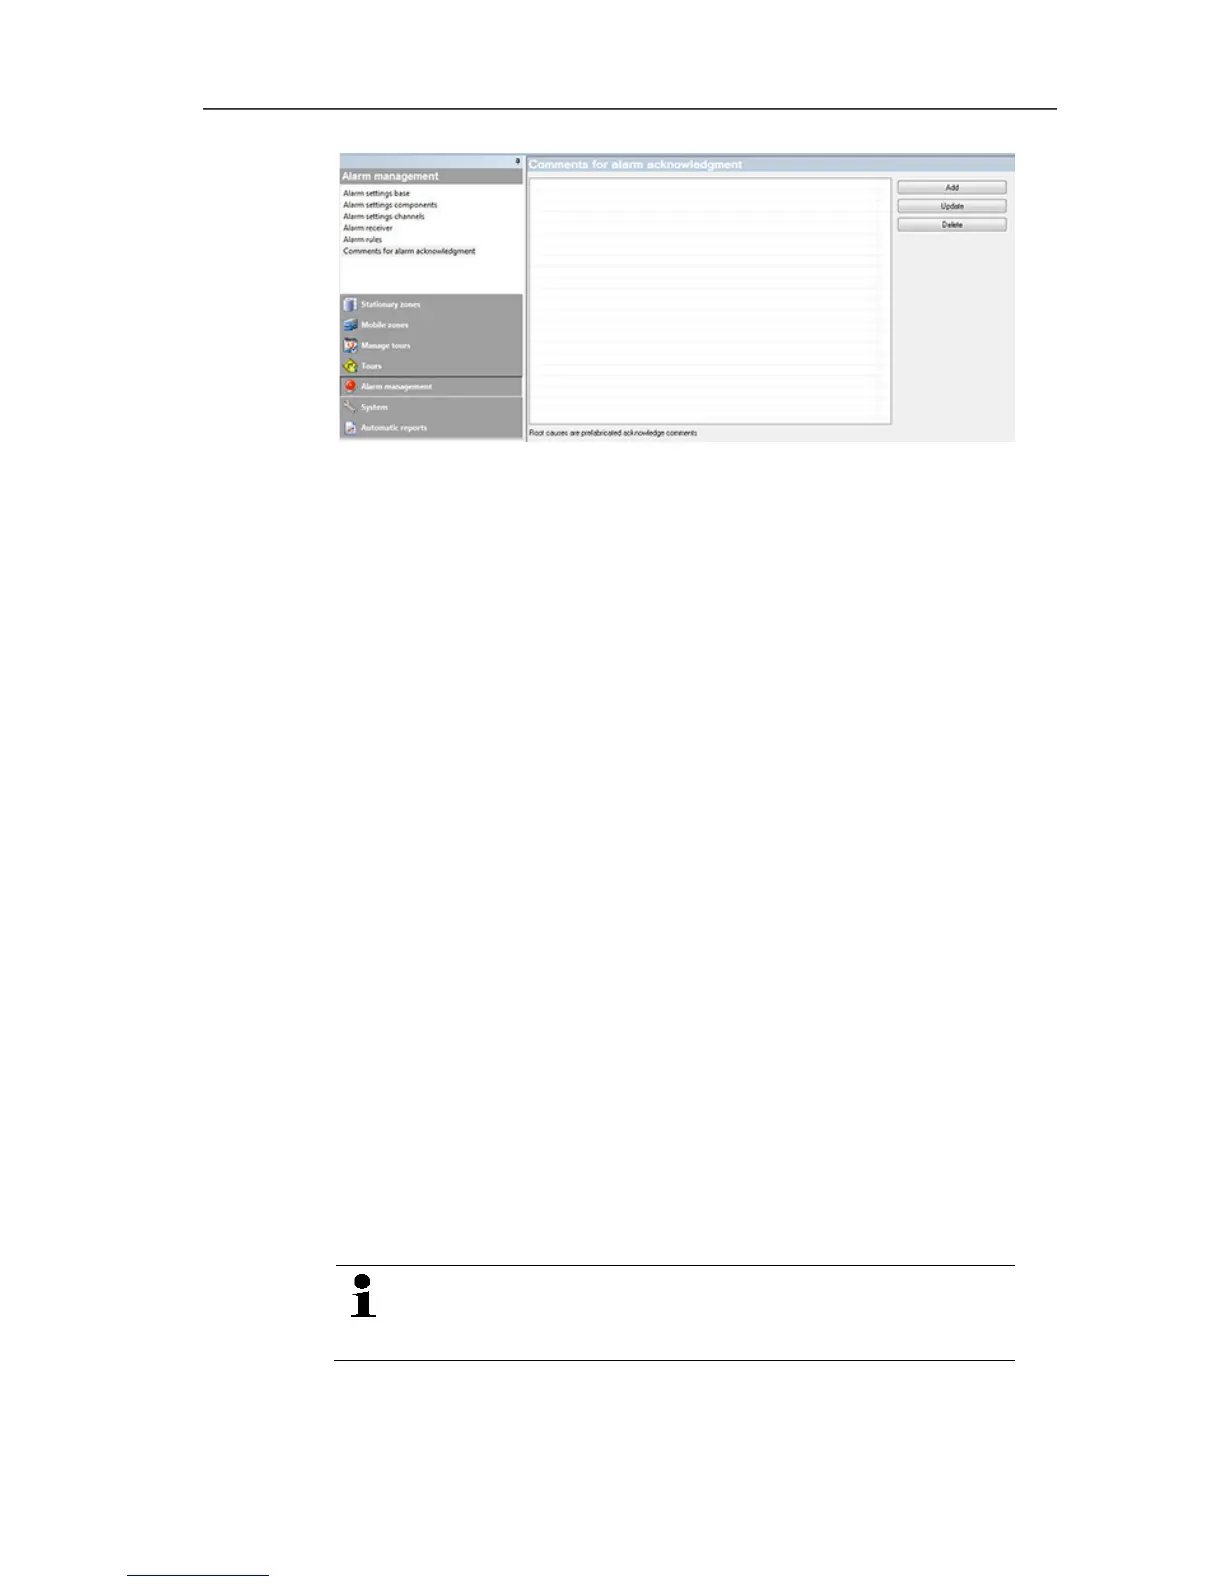
3. [New]: Create an acknowledgement comment.
[Edit]: Edit an existing acknowledgement comment.
[Delete]: Delete an existing acknowledgement comment.
Pos: 155 /TD/Produ kt verwenden/testo Sa veris/05 Prof- Messreihen analysieren @ 1\mod_1198144299343_79.d ocx @ 6825 @ 3 @ 1
6.6. Analyzing series of measurements
You can represent series of measurements as a diagram or a table.
> In the Start | View menu, select the
• Mark Graph if the data should be displayed graphically and
select the display format.
The measurement data can be displayed as Diagram,
Histogram or Number field.
• Table function if the data should be displayed as a table.
Pos: 156 /TD/Produ kt verwenden/testo Sa veris/05a Diagramme ana lysieren/00 Diagr amme @ 0\mod_118899658140 6_79.docx @ 3484 @ 3 @ 1
6.6.1. Diagram view
In this view, the readings are shown as line diagrams.
In the Start | View menu, the Diagram command is activated. Now
you have to select the data record that you wish to display.
1. Select the day or time period in the calendar that should be
evaluated.
2. In the tree structure of the data range, open the group that
contains the data to be displayed.
- The diagram for the selected data is shown.
> If necessary, deactivate channels via the checkboxes for the
display.
You can show or hide the gridlines for the
corresponding axis by clicking on the time axis or the
value axis.