6 Using the product
151
Pos: 171 /TD/Produ kt verwenden/testo Sa veris/05b Tabellen a nalysieren/02 Markier ung aufheben @ 0\mod_1188 996637078_79.doc x @ 3575 @ 3 @ 1
6.6.4.2. Dropping the marking
> Click on Edit | Tools | Drop marking.
- The marking of the readings is deleted.
Pos: 172 /TD/Produ kt verwenden/testo Sa veris/05b Tabellen a nalysieren/03 Extre mwert oder Mittelwert einf ügen @ 0\mod_1188996637 890_79.docx @ 3585 @ 4 @ 1
6.6.4.3. Inserting extreme values or mean in the table
Insert the minimum/maximum reading as well as the mean from the
whole table at the end of the table.
1. Click on Edit | Tools | Extra lines | Minimum, Maximum or
Mean value.
- A row with the corresponding value for all readings is inserted at
the end of the table.
> Repeat step 1 to insert another value in the table.
To erase a value from the table again, click in the Extra
lines menu again on the corresponding entry.
Pos: 173 /TD/Produ kt verwenden/testo Sa veris/05b Tabellen a nalysieren/04 Verdi chten @ 0\mod_1188996638 437_79.docx @ 3595 @ 3 @ 1
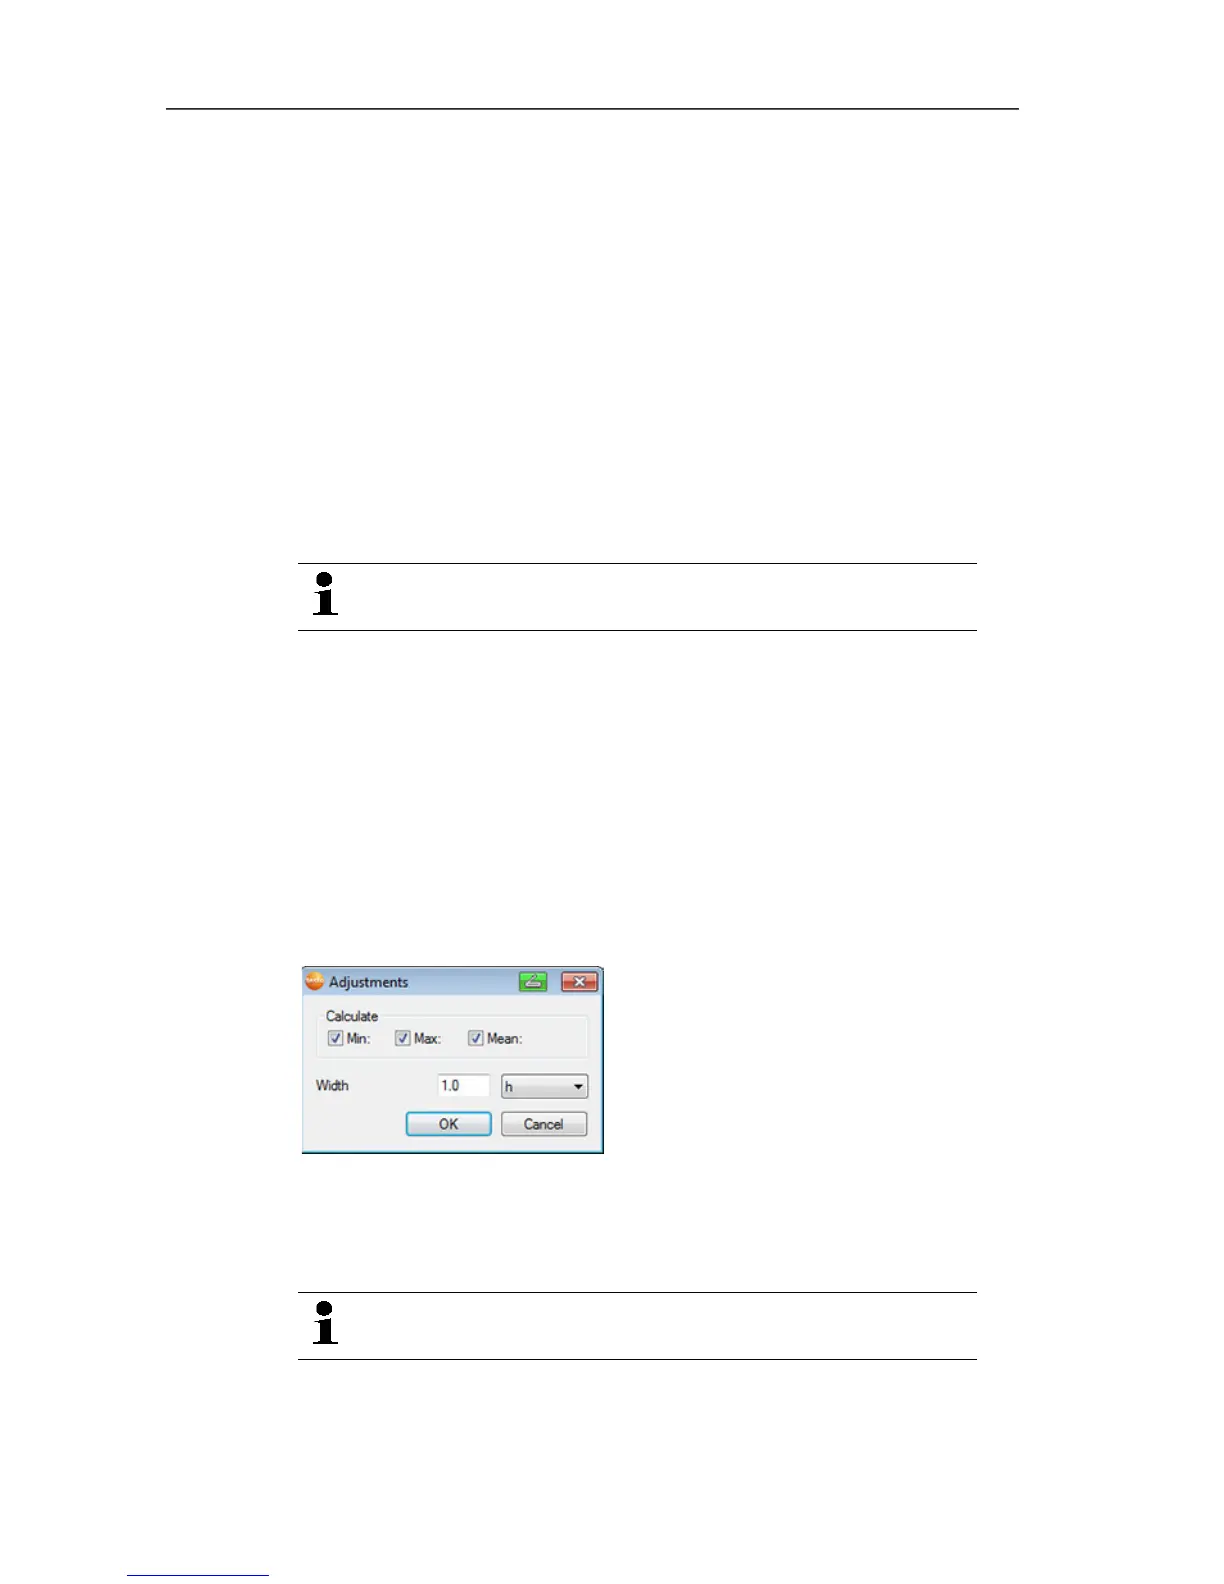
6.6.4.4. Compressing readings
Compress the table to definable intervals to maintain the clarity of
the table with large amounts of data.
Only the first and the last value are shown for the individual
intervals. The other readings are hidden.
In addition, the minimum, maximum and/or average value can be
shown for the respective time period.
1. Click on Edit | Tools | Compress.
- The dialogue for determining the options is opened.
> Use the checkboxes to determine whether the respective
minimum reading (Min), maximum reading (Max) and/or
average value (Mean) should be calculated for the individual
time spans.
At least one of these values must be activated to be
able to perform the compression of the table.
2. Enter the time span under Extract and determine its unit.
Possible settings for the unit: