TI-83, TI-83 Plus, TI-84 Plus Guide
To draw a graph of the normal density function, note that nearly
all of the area between this function and the horizontal axis lies
within three standard deviations of the mean. Set
Xmin = 9 – 3 = 6
and
Xmax = 9 + 3 = 12. Use ZoomFit to draw the graph. Reset
Ymin to
−
0.1 in preparation for the next step, and press GRAPH .
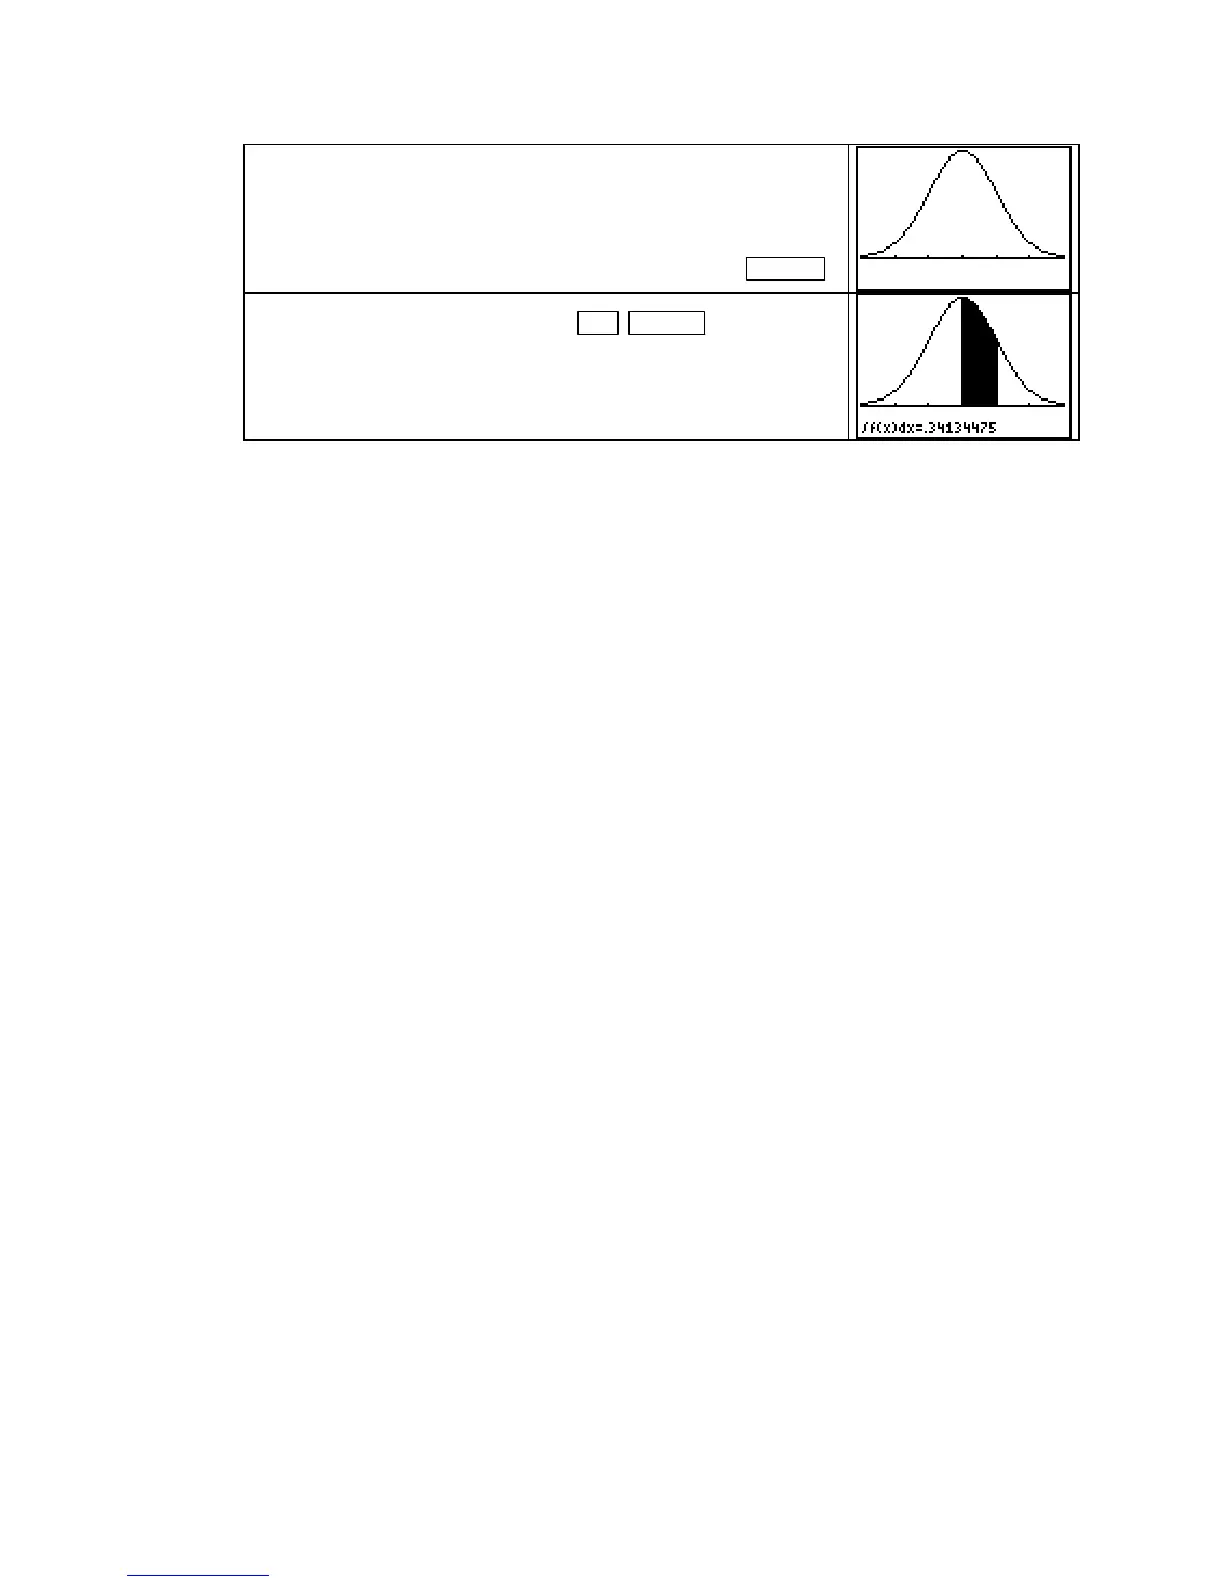
With the graph on the screen, press 2nd TRACE (CALC) 7
[∫f(x)dx].
At the Lower Limit? prompt, enter 9. At the Upper
Limit? prompt, enter 10. The probability is displayed as an area
and the value is printed at the bottom of the graphics screen.
Copyright © Houghton Mifflin Company. All rights reserved.
89

 Loading...


