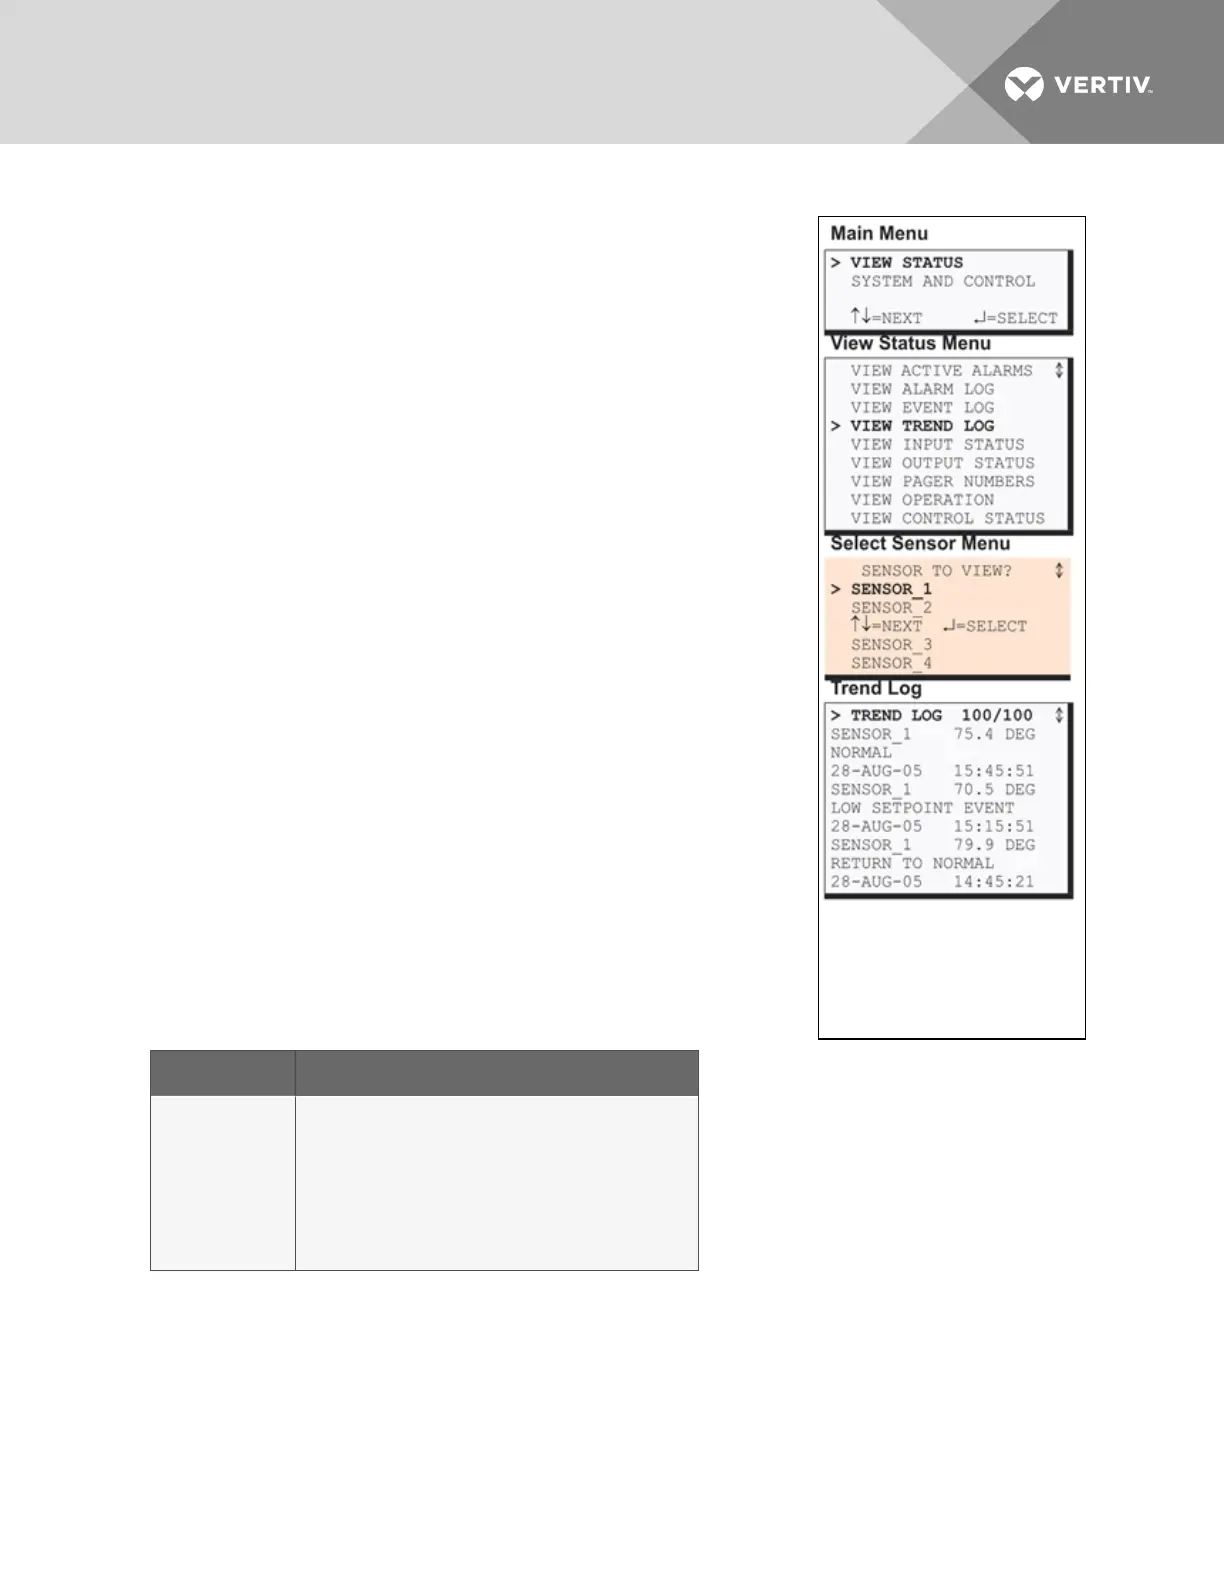
5.4 View Trend Log
The Liebert AC8 takes readings of configured analog input sensors at
regular intervals and stores them in four separate trend logs, one for each
sensor. The time interval is 30minutes. Each log contains up to 100records.
Follow these steps to select a sensor and view its trend log:
5.4.1 Select a Sensor
To select a sensor:
• From the Main Menu, use the arrows to choose View Status,
then press Enter.
• From the View Status Menu, use the arrows to choose View
Trend Log, then press Enter.
• From the Sensor Selection Menu, use the arrows to choose the
sensor you want to view—Sensor_1 in the example at right—and
press Enter.
5.4.2 View a Trend Log
The Trend Log screen displays up to 100 records for the selected sensor. If
the log contains records, the screen displays details for each reading:
• the name of the selected sensor (for example, SENSOR_1)
• the reading (75.4 DEG)
• a brief description of the reading status (NORMAL)
• the date and time of the reading
Table 5.3 below shows conditions that the trend log records for analog
inputs. Each analog input has its own trend log.
SOURCE Analog Input
CONDITIONS
RECORDED
LOW SETPOINT ALARM
LOW SETPOINT EVENT
HIGH SETPOINT ALARM
HIGH SETPOINT EVENT
RETURN TO NORMAL
NORMAL
SENSOR PROBLEM (denoted by dashes ------)
Table 5.3
Trend log conditions
If there are no records in the log, the screen displays the message:
NO TRENDS
Viewing Additional Screens
There may be up to 100 records of trend data for the selected sensor.
Vertiv | Liebert® AC8 User Manual | 41