Stratus OCT User Manual PN 2660021134133 A
Analysis Protocols
6-21
Output Display
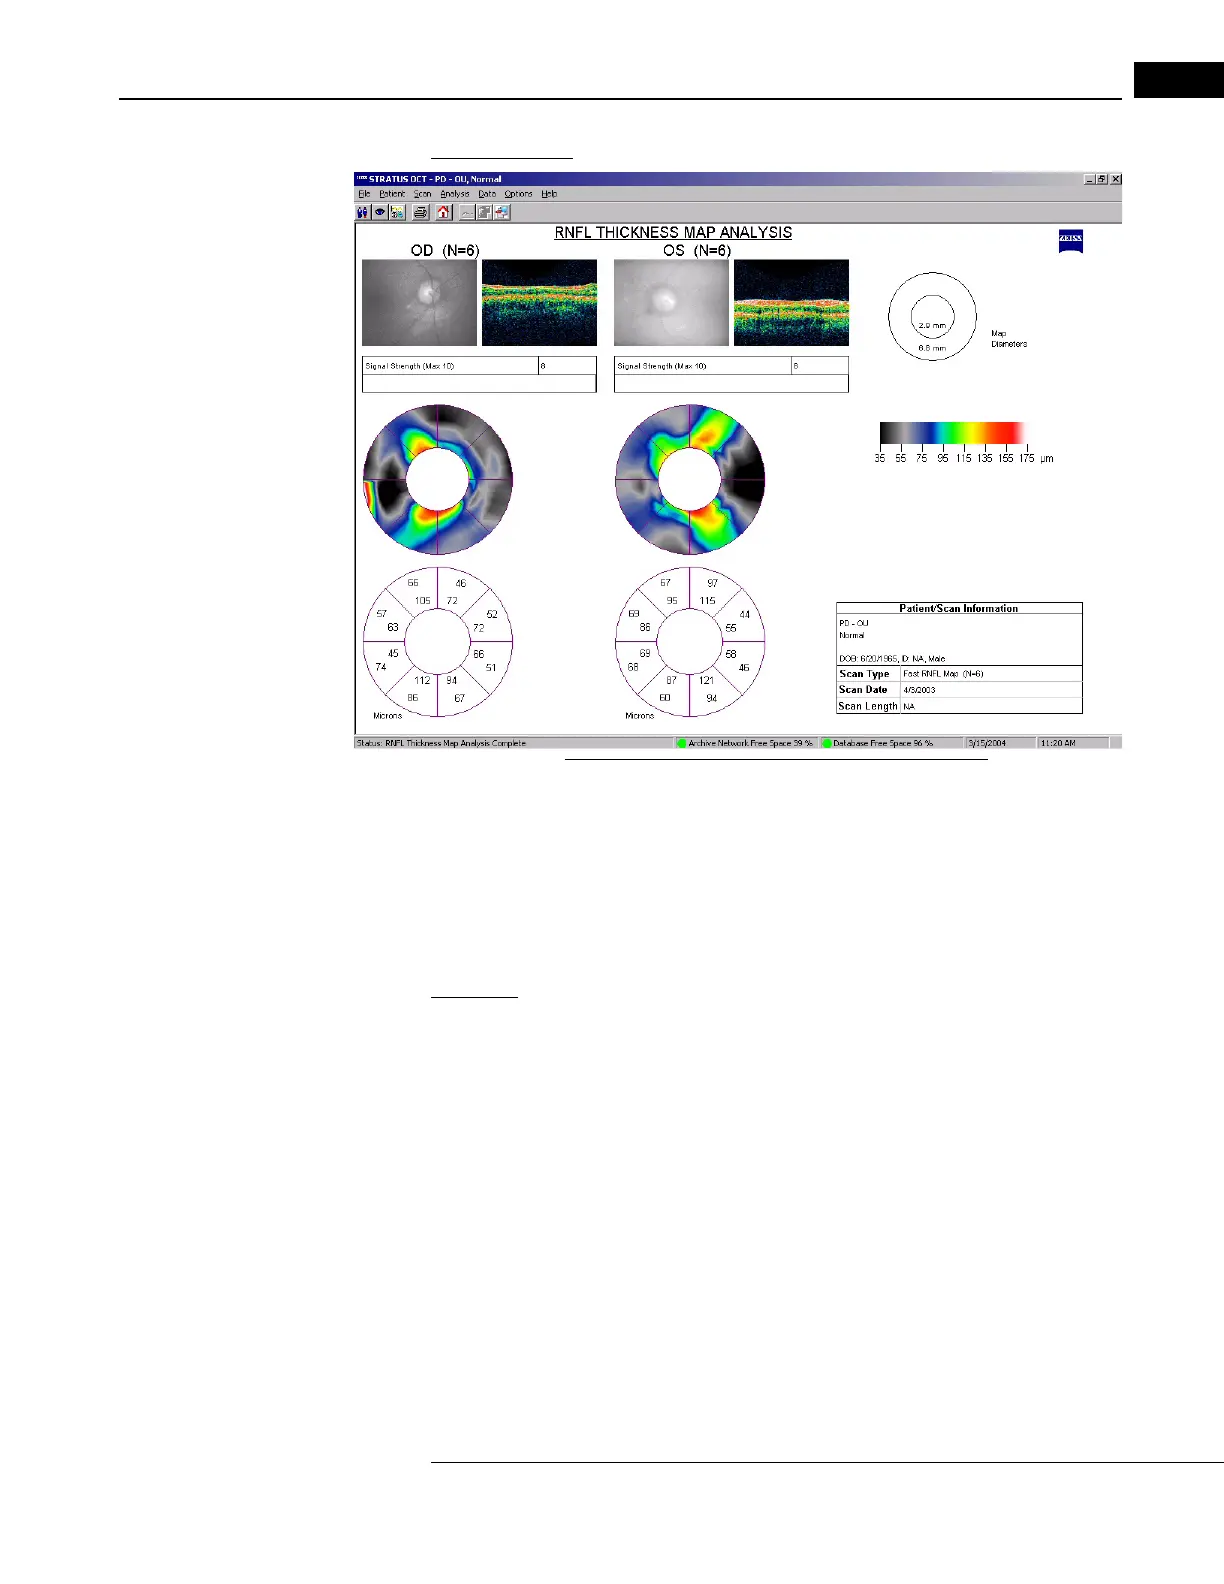
Figure 6-12 RNFL Thickness Map Analysis Output
• The upper map presents RNFL thickness using a color code. The color scale appears at
right. The lower map shows average RNFL thickness in the inner and outer areas of
eight map sectors, in micrometers. A key of the map circle diameters appears at upper
right (fixed at 2.9 and 6.8 mm).
RNFL Thickness Change
Application: Select RNFL Thickness Change to assess changes in RNFL thickness between
examinations. You can apply this protocol to two OD and/or two OS scan groups of equal
radius made from the following protocols: Circle, Proportional Circle, (F
AST) RNFL
Thickness (3.4), RNFL Thickness (2.27xdisc) or Nerve Head Circle.