Analysis Protocols
Stratus OCT User Manual PN 2660021134133 A
6-22
Output Display
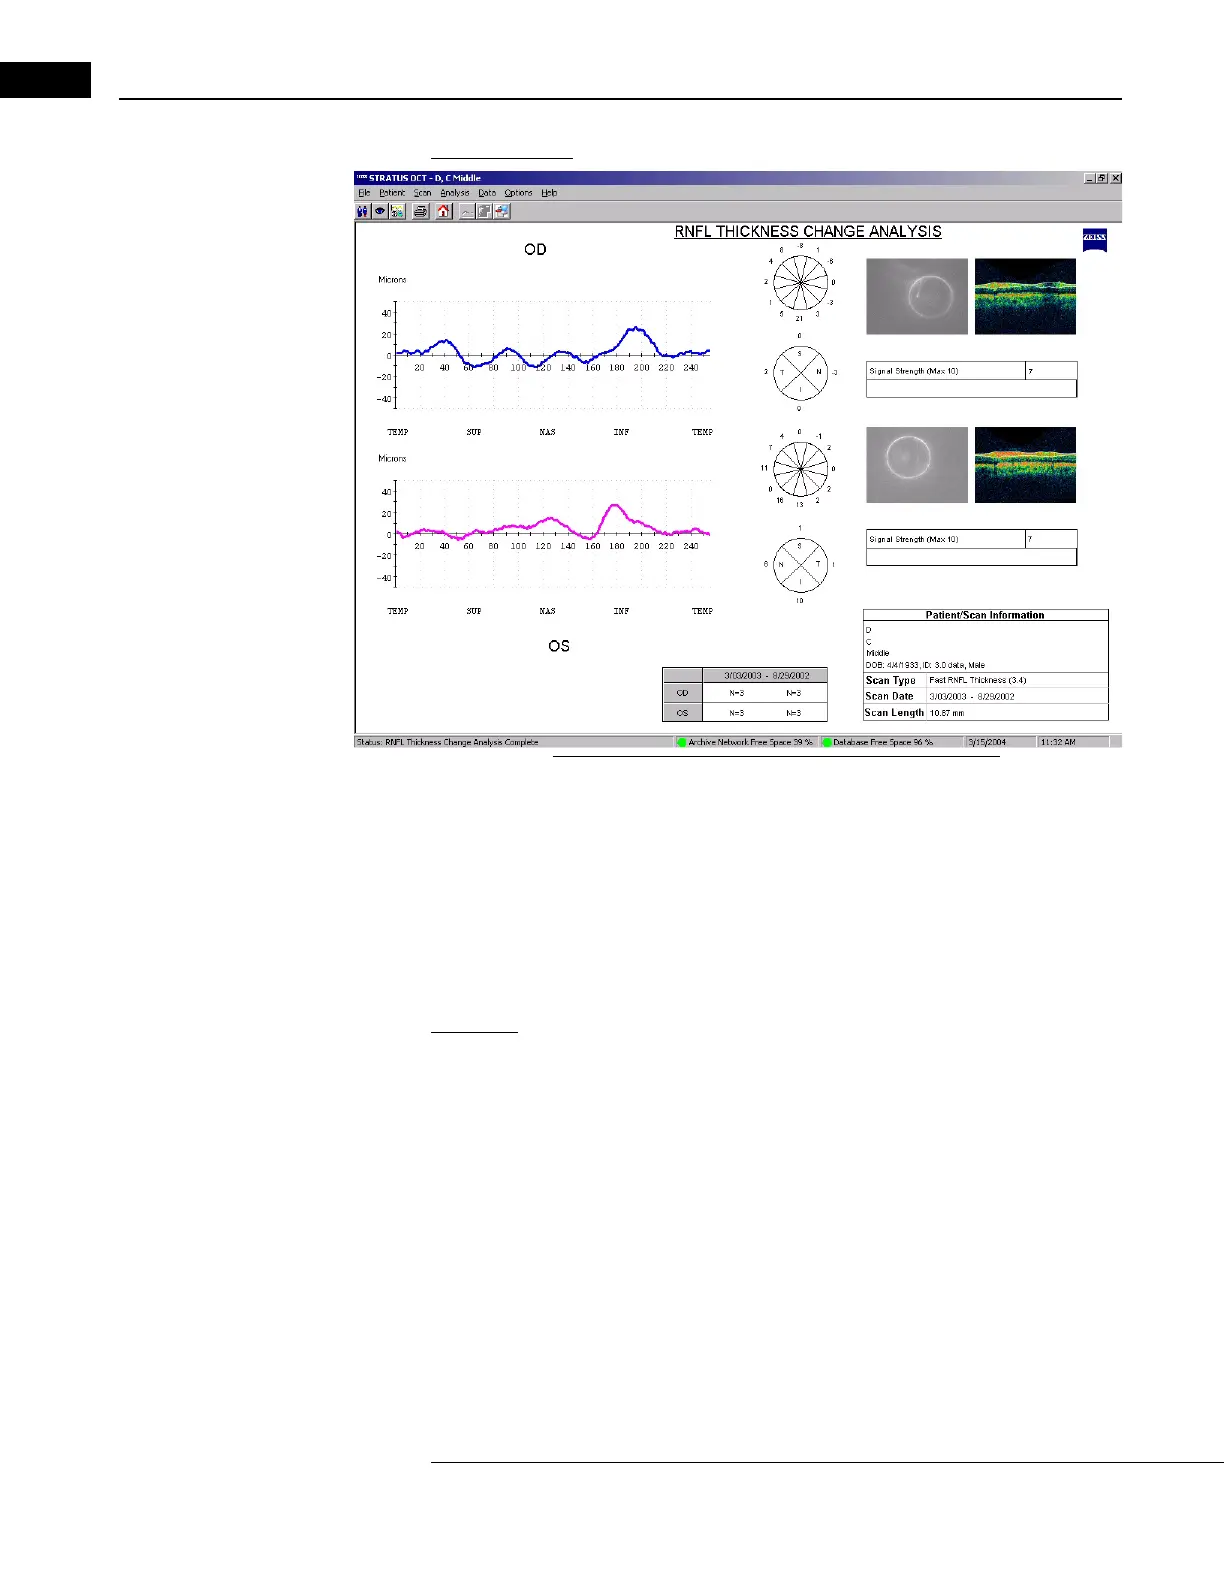
Figure 6-13 RNFL Thickness Change Analysis Output
• The graphs show RNFL thickness change between examinations (vertical axis) versus
A-scan location (horizontal axis). The graphs indicate the temporal, superior, nasal
and inferior quadrants.
• To the right of the graphs, for each eye, cir
cular diagrams show quadrant and
clock-hour RNFL average thickness changes between examinations.
RNFL Thickness Serial Analysis
Application: Select RNFL Thickness Serial Analysis to do a comparative analysis of RNFL
thickness over time. You can apply this analysis simultaneously to up to four OD and/or four
OS scan groups of equal radius and same scan type. You may choose from the following
protocols: Circle, Proportional Circle, (F
AST) RNFL Thickness (3.4), RNFL
Thickness (2.27xdisc) or Nerve Head Circle.