Stratus OCT User Manual PN 2660021134133 A
Analysis Protocols
6-33
Note: It is the clinician’s responsibility to associate patient information with
exported files.
Retinal Map
Application: Select Retinal Map to obtain two maps of retinal thickness in a circular area
centered on the macula. One map shows retinal thickness using a color code, and the
other shows average retinal thickness (in micrometers) in nine map sectors. This analysis
protocol operates on one Line or (F
AST) Macular Thickness Map scan group at a time.
These scan protocols consist of a group of 6 to 24 line scans arranged in a spoke pattern.
Th
e algorithm computes retinal thickness separately for each line scan, and combines the
results to construct the circular maps. Normative data will appear in the output if you
analyze a Fast Macular Thickness Map (Fast Mac) scan, as described in Macula
Normative Database on page 6-7.
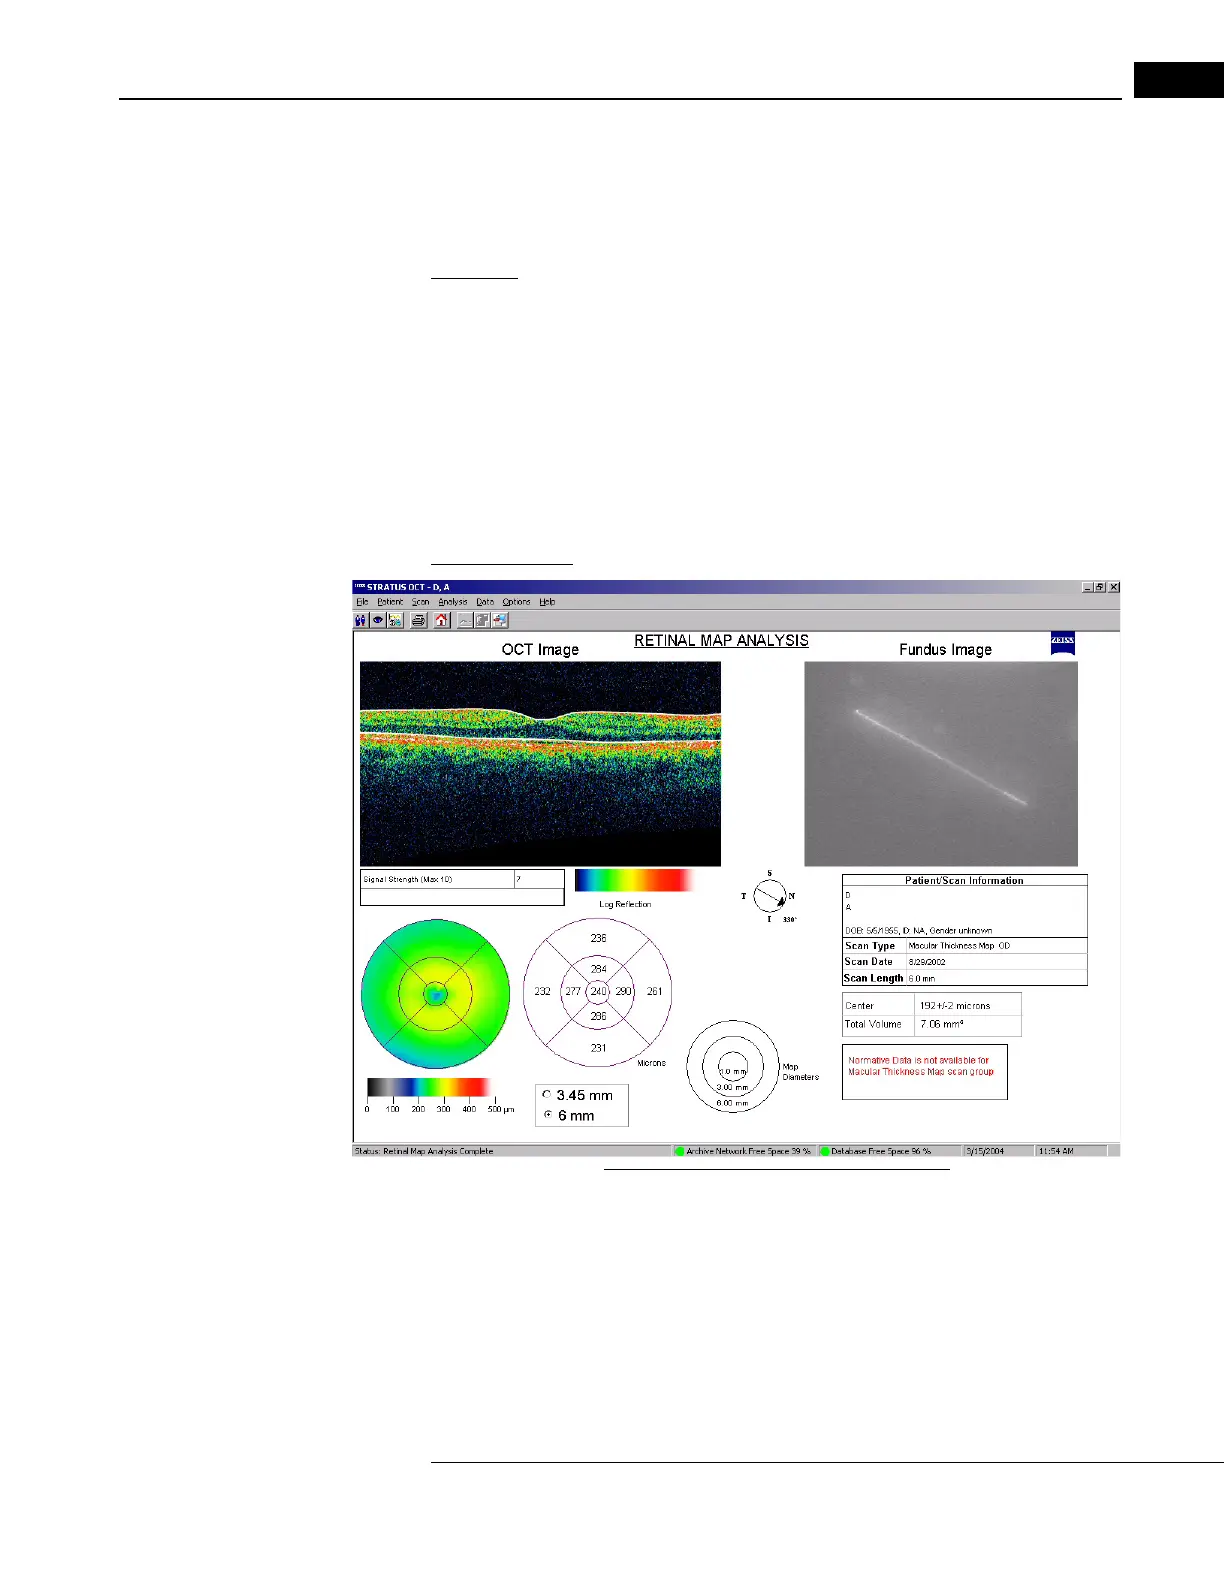
Output Display
Figure 6-18 Retinal Map Analysis Output
On the lower left, the analysis output includes two retinal thickness maps. The left map
presents retinal thickness using a color code. The color scale appears below. The right map
shows average retinal thickness in each area, in micrometers. Each map consists of three
concentric circles, the outer two divided into sectors. A key of the map circle diameters
appears at bottom center.