Stratus OCT User Manual PN 2660021134133 A
Analysis Protocols
6-7
to each particular A-scan location in the graph, to the quadrant and clock hour averages in
the circular graphs, and to the OD and OS columns of the data table. Among same-age
individuals in the normal population, the percentiles apply to each particular RNFL
thickness measurement as follows:
• The thinnest 1% of measurements fall in the red area. Measurements in red are
consider
ed outside normal limits (red < 1%, outside normal limits).
• The thinnest 5% of measurements fall in the yellow area or below
(1
% yellow < 5%, suspect).
• 90% of measurements fall in the green area (5% green 95%).
• The thickest 5% of measurements fal
l in the white area (white > 95%).
Note: Clinicians must exercise judgment in the interpretation of the RNFL normative
data. For any particular measurement, note that 1 out of 20 normal eyes (5%) will
fall below green.
Macula Normative Database
The Fast Macular Thickness Map (Fast Mac) scan protocol was used to acquire the
macular thickness normative data. The
Macula Normative Database is applicable only to
scans acquired with this scan protocol. Normative data that is age-matched to the patient
appears when you perform the Retinal Thickness, Retinal Thickness/Volume
Tabular, or Retinal Map analysis protocols on a Fast Macular Thickness Map (Fast
Mac) scan.
When the Retinal Thickness, Retinal Thickness/Volume Tabular, or Retinal Map
analysis protocols are applied to a Fast Macular Thickness Map (Fast Mac) scan, the
age-matched normative data app
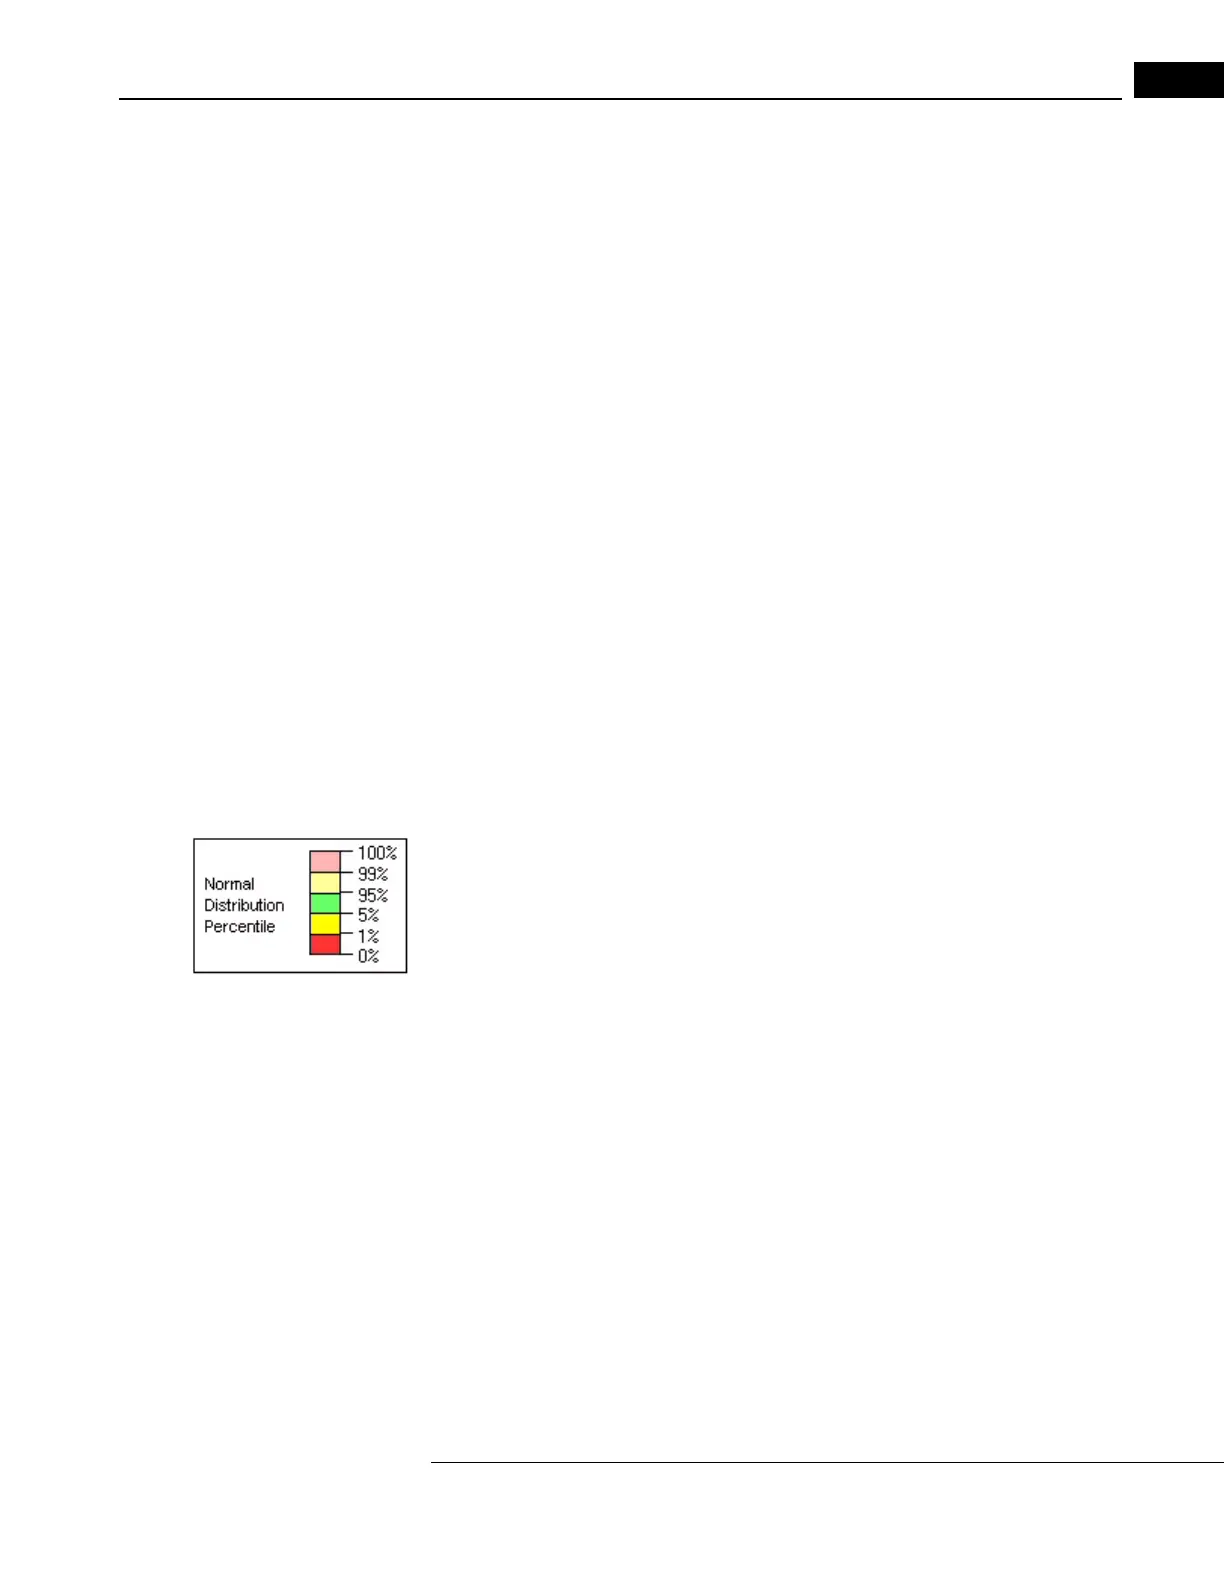
ears. It uses a light red-light yellow-green-yellow-red
color code, as seen in the legend at left, to indicate the normal distribution percentiles. The
color code applies as follows:
•In the Retinal Thickness output, to each particular A-sca
n location in the thickness
chart.
•In the Retinal Thickness/Volume Tabular output, to the circular maps of retinal
thickness or volume, and to the OD an
d OS columns of the data table.
•In the Retinal Map output, to the circular maps of retinal thickness.
Among same-age individuals in th
e normal population, the percentiles apply to each
particular retinal thickness measurement as follows:
• The thickest 1% of measurements fall in the
light red area. Measurements in light red
are considered outside normal limits. (light red > 99%, above normal limits).
• The thickest 5% of measurements fall in the light yellow area or above (95% < light
yello
w 99%, suspect above normal)
• 90% of measurements fall in the green area (5% green 95%).