Analysis Protocols
Stratus OCT User Manual PN 2660021134133 A
6-14
Output Display
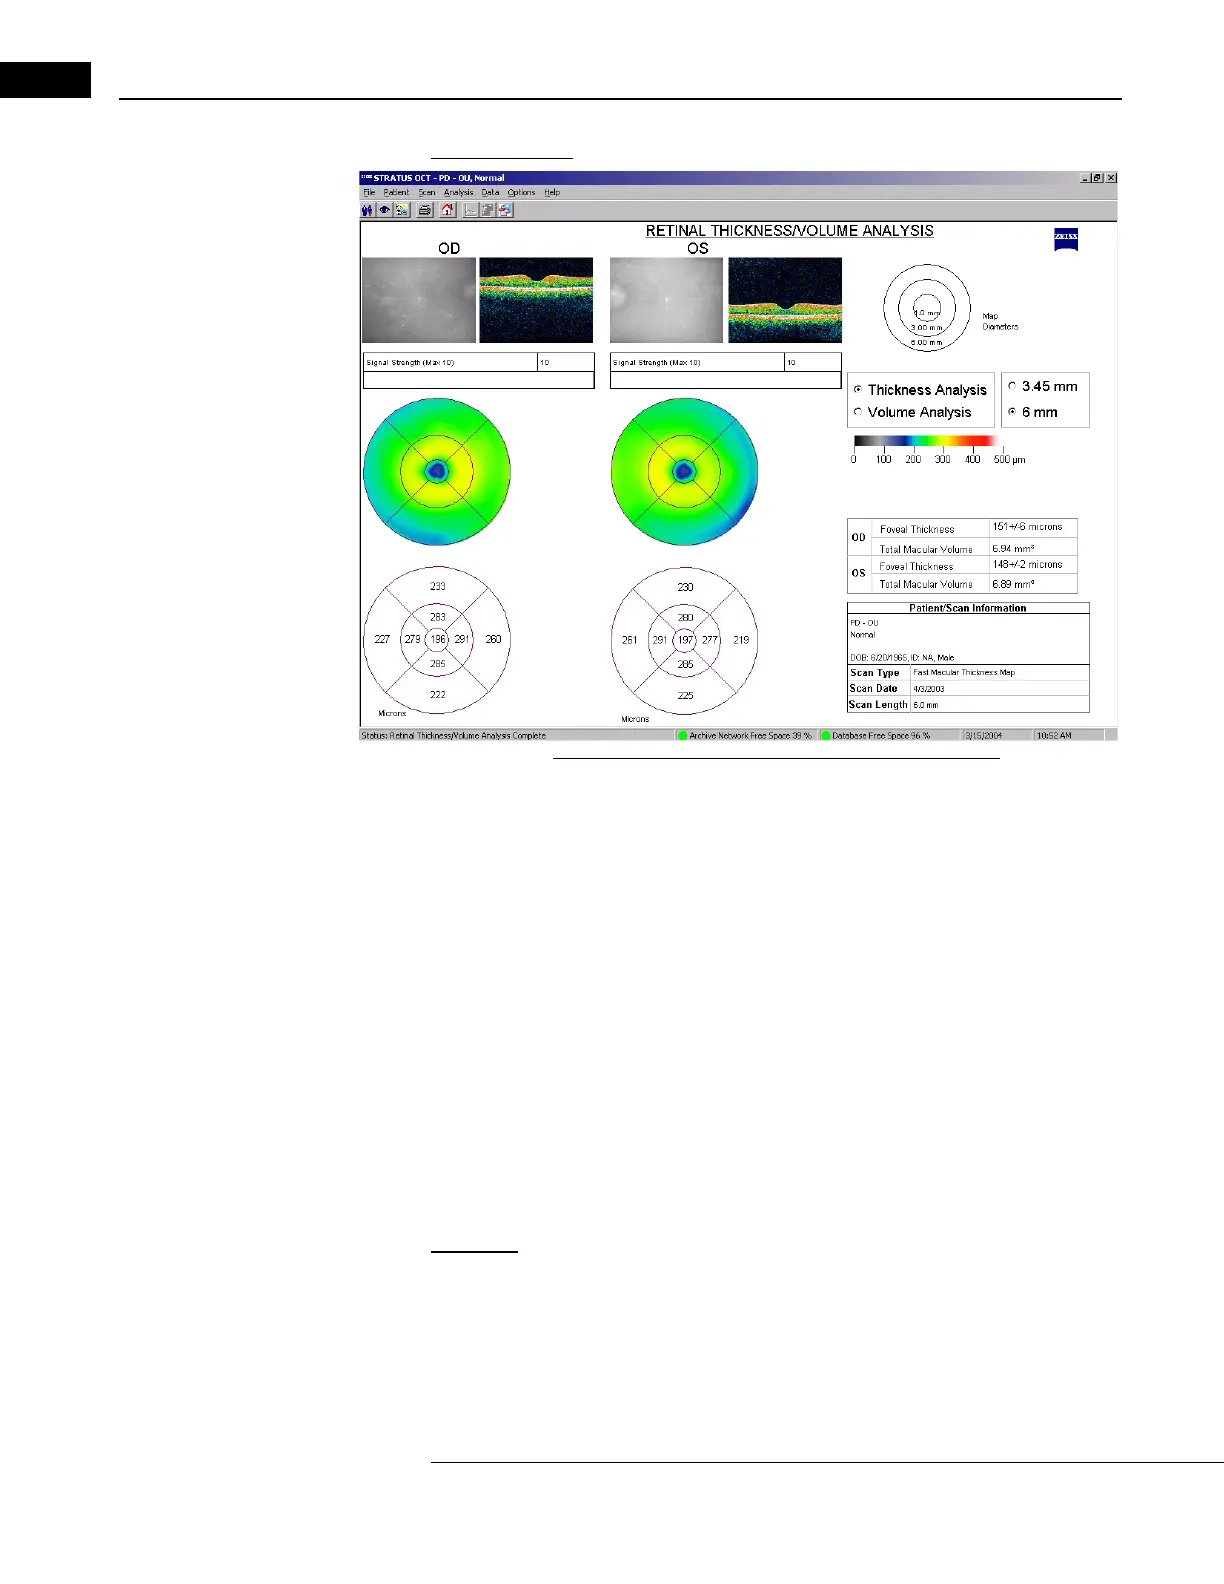
Figure 6-6 Retinal Thickness/Volume Analysis Output
•The output display has the same layout for both thickness and volume analysis. The
upper map always presents retinal thickness using a color code. The color scale
appears to the right. The lower map shows either average retinal thickness (in
micrometers) or volume (in mm
3
) in each area. The default output is a thickness
analysis. Click the radio button at upper right to display the volume analysis.
• A key of the map circle diameters appears at upper right. The default diameters are 1,
3 and 6 mm. Cli
ck the 3.45 mm radio button at upper right to change to circle
diameters of 1, 2.22, and 3.45 mm.
• On the lower right, numeric informati
on for each eye includes: Foveal Thickness
which represents the calculation of average thickness in micrometers +/- the standard
deviation for the center point, where all the scans intersect; and Total Macular
Volume of the retinal map area in mm
3
.
Retinal Thickness/Volume Tabular
Application: Select Retinal Thickness/Volume Tabular to obtain all the output of the
Retinal Thickness/Volume analysis (see above), plus a data table that includes
thickness and volume quadrant averages, ratios and differences among the quadrants and
betwee
n the eyes. This analysis protocol operates on one OD and/or one OS scan group
made with the Line or (F
AST) Macular Thickness Map protocols. Normative data will
appear in the output if you analyze a Fast Macular Thickness Map (Fast Mac) scan,
as described in Macula Normative Database on page 6-7.