Stratus OCT User Manual PN 2660021134133 A
Analysis Protocols
6-15
Output Display
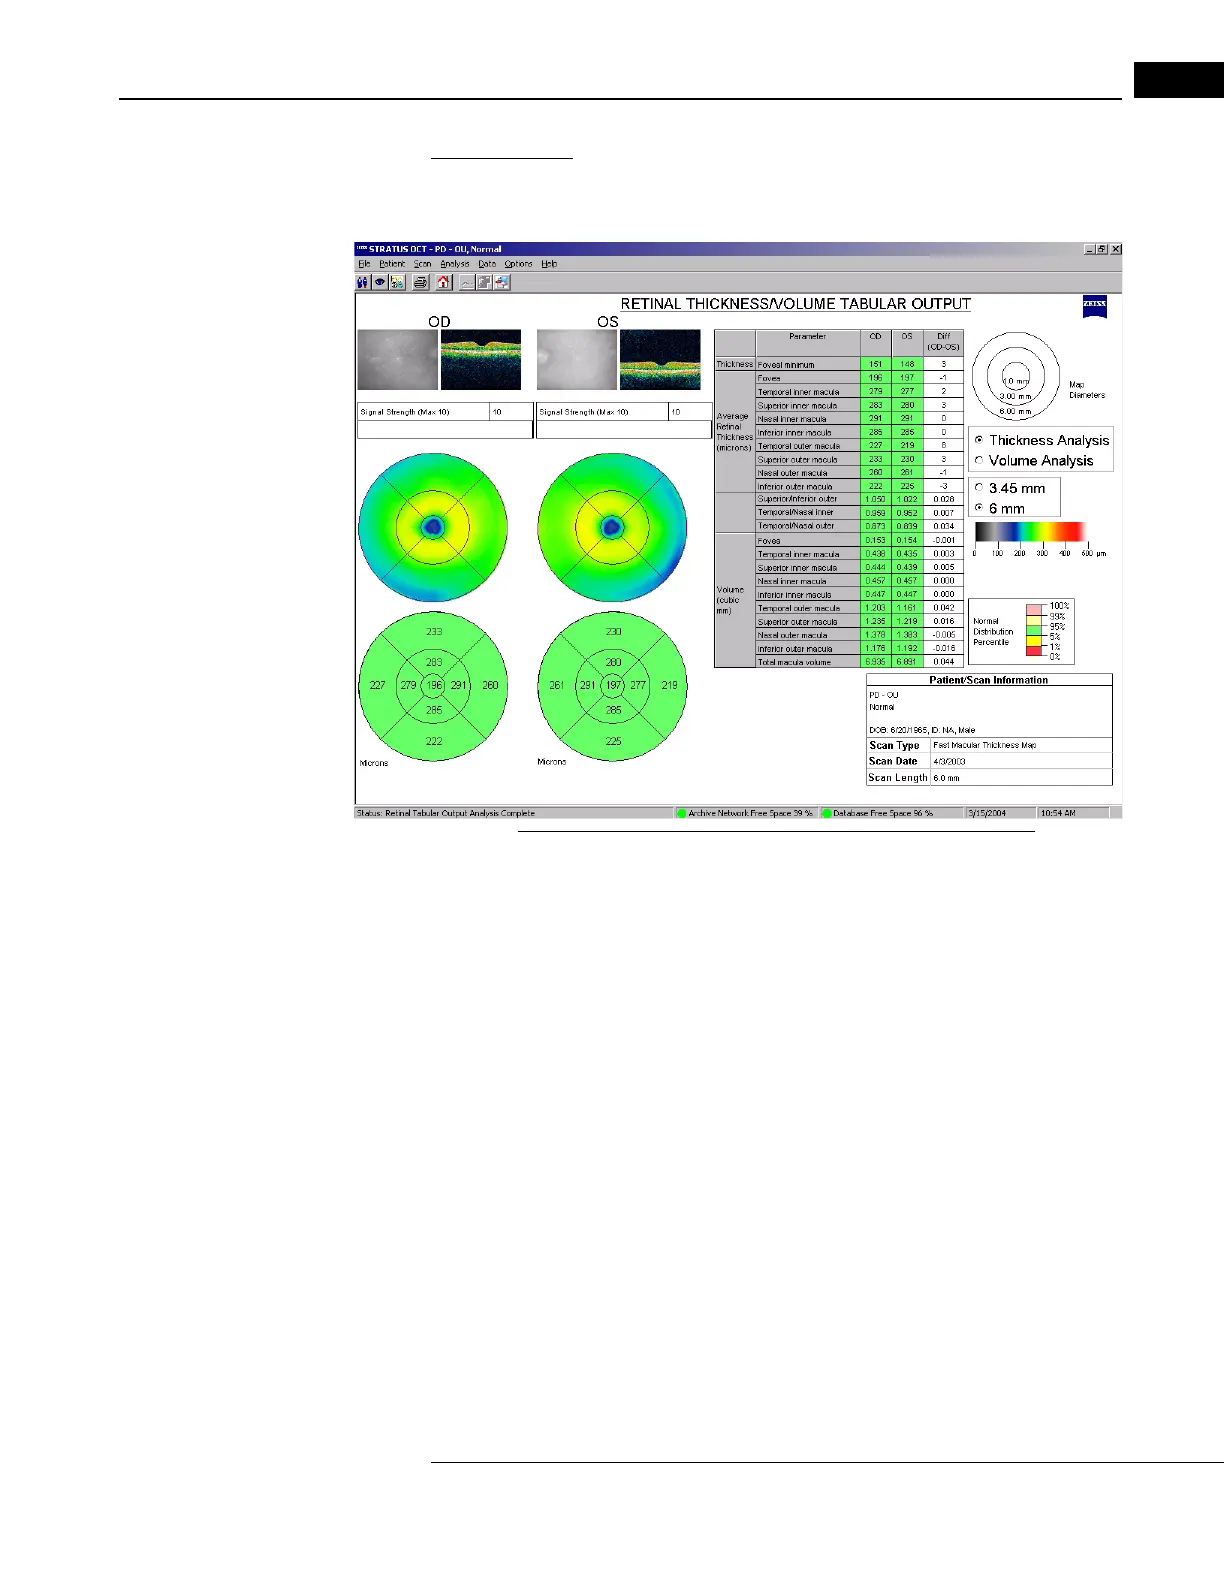
The output display includes all the elements of the Retinal Thickness/Volume analysis
(see above), with a different arrangement to accommodate the table.
Figure 6-7 Retinal Thickness/Volume Tabular Analysis Output
When applied to a Fast Macular Thickness Map (Fast Mac) scan, the macula
normative data color code applies to the OD and OS columns of the data table, and to the
l
ower circular maps. The lower maps show average retinal thickness (or volume) for each
map sector, in micrometers, and applies the normal distribution percentile colors to those
sector averages. To the lower right of the table, the Normal Distribution Percentile
legend appears.
Among same-age individuals in th
e normal population, the percentiles apply to each
particular retinal thickness measurement as follows:
• The thickest 1% of measurements fall in the
light red area. Measurements in light red
are considered outside normal limits. (light red > 99%, above normal limits).
• The thickest 5% of measurements fall in the light yellow area or above (95% < light
yello
w 99%, suspect above normal)
• 90% of measurements fall in the green area (5% green 95%).
• The thinnest 5% of measurements fall in the yellow area or below
(1
% yellow < 5%, suspect below normal).
• The thinnest 1% of measurements fall in the red area. Measurements in red are
consider
ed below normal limits (red < 1%, below normal limits).