Analysis Protocols
Stratus OCT User Manual PN 2660021134133 A
6-4
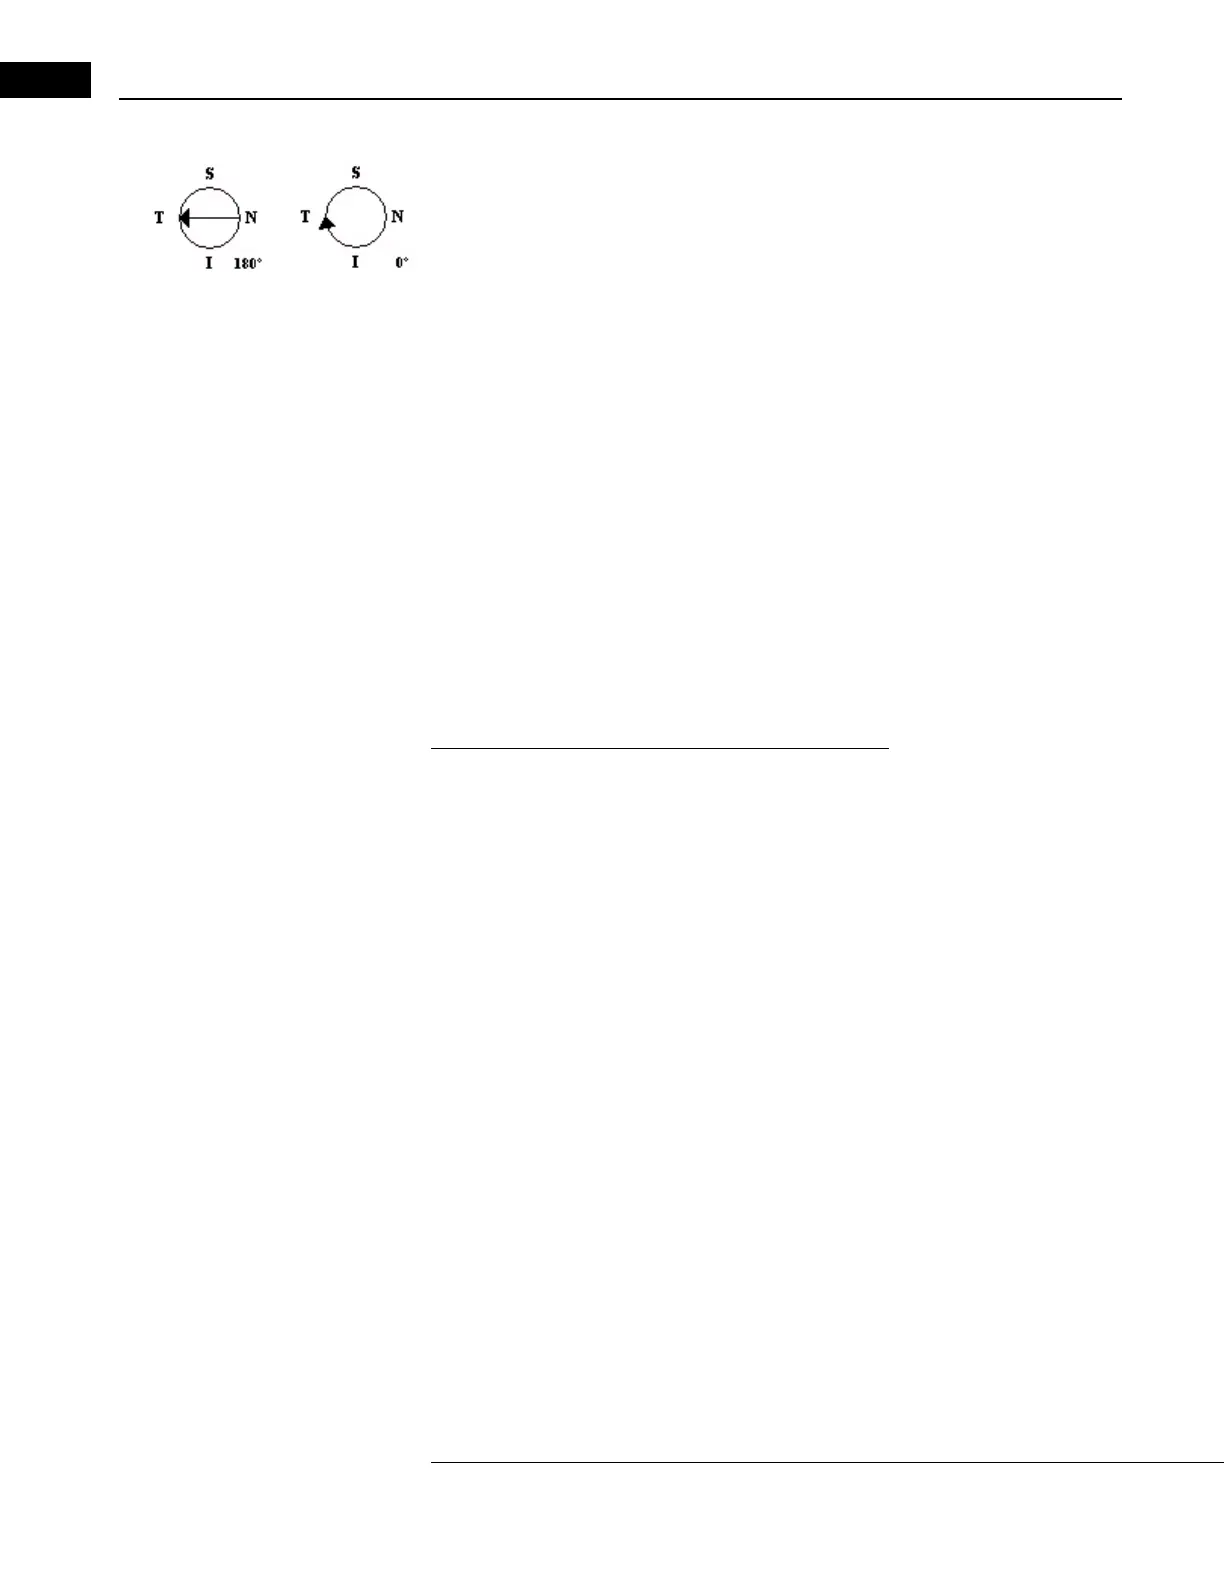
Scan Direction Legend
The analyses that display a processed scan image include a legend that indicates the path
and direction of the currently displayed scan, as shown in the examples at left. The legend
enables you to orient the scan image with respect to the scan path. The scan angle (in
degrees, for line scans) is at lower right. See Angle on page 3-14 for an explanation of
the angle notation.
Signal Strength Indicator and Scan Messages
The Stratus OCT evaluates the signal strength of
frozen or saved scan images and assigns a
number from 0 (worst) to 10 (best), which it displays in the signal strength field. The
Stratus OCT also analyzes the vertical placement and completeness of the scan image and,
if applicable, returns one of the messages “Scan too high,” “Scan too low” or “Scan
missing data” in the scan message field. The signal strength and scan message fields
appear on the S
CAN ACQUISITION WINDOW (Figure 3-3, page 4), the SCAN REVIEW WINDOW
(Figure 3-7, page 3-13), the SELECTION WINDOW (Figure 5-4, page 5-4) and on all
analysis output windows and analysis printouts. The additional message “Analysis
Con
fidence Low” can appear in the scan message field on the analysis output windows
and printouts of all quantitative analysis protocols, except for the Optic Nerve Head
analysis.
Interpreting Signal Strength and Scan Messages
Signal strength provides a guideline for scan image quality. In general, greater signal
strength indicates a better image and thus higher confidence in the resulting analyses.
When acquiring a scan, the operator should try to optimize the OCT image to achieve a
signal strength of 7 or greater and a uniform brightness across the scan. In general, if the
signal strength is below 5, or if any scan message appears, the scan should be repeated. It
is important to note that whenever you analyze a scan, you should also check the analysis
results for the message “Analysis Confidence Low.” If this message appears, the results
could be unreliable.
Note that media problems associated with many
retinal diseases (vitreous opacities,
hemorrhages, lens opacities, etc.) can make it impossible to achieve a signal strength of 5,
even with careful scanning. Nevertheless, such scans can be useful for visual analysis of
the retinal structure and the association between the retinal layers. In assessing retinal
status, visual analysis of the retinal structure is important and may be highly indicative.
Furthermore, if you find that the retinal layer boundaries (white lines generated by the
an
alysis algorithm) clearly conform to the visible tissue contours, the resulting
measurements are reliable, even if the signal strength is below 5. At the same time, when
the retinal layer boundaries do not conform to the visible tissue contours, the resulting
measurements will not be accurate in those areas, even if the signal strength is 7 or
greater. Note that the RNFL boundary can be difficult to identify, so analysis of RNFL
images with a signal strength below 5 is not recommended.