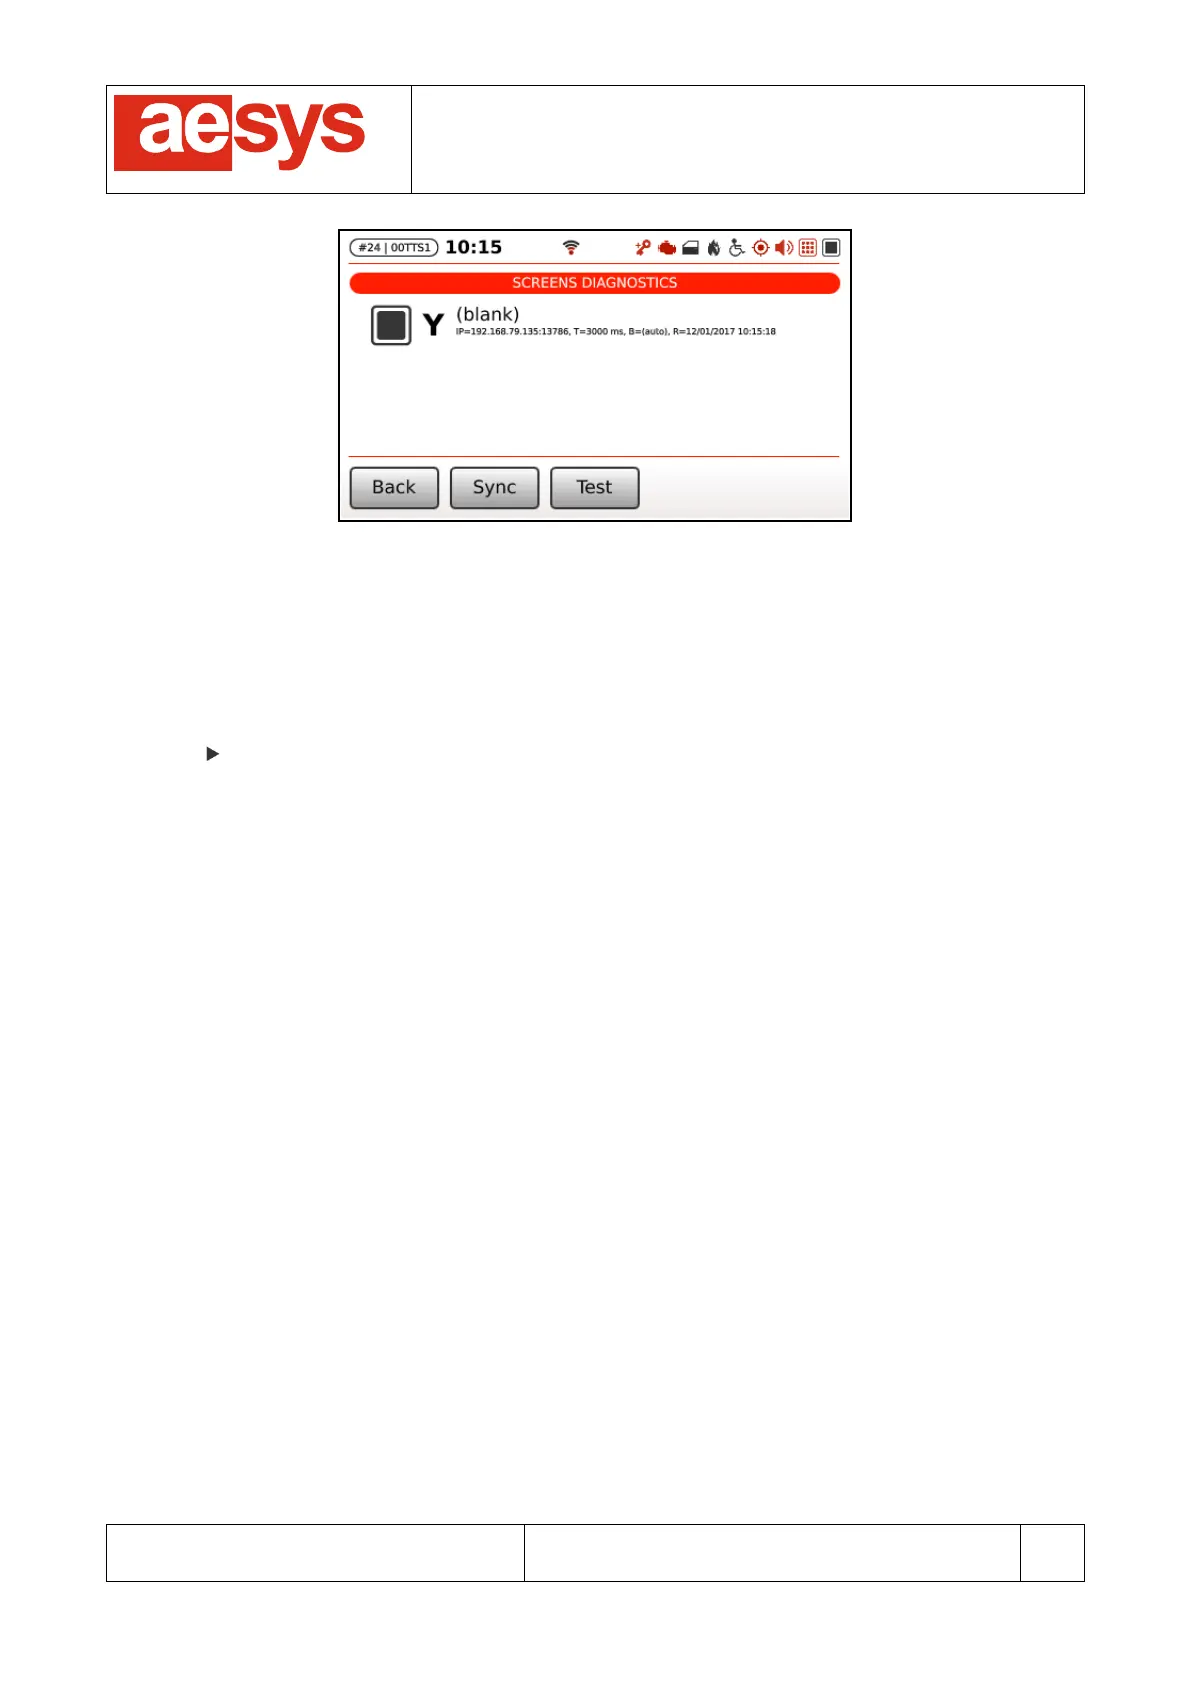
Figure 59: Screens diagnostics
The list of screens managed by the control unit is shown on the screen. The IP address/TCP port and some
functional parameters of every sign are reported (being “T” the communication timeout, “B” the brightness,
and “R” the last display response timestamp.
Every screen entry also reports a description of the current publication being shown (“blank” stands for no
active publication, otherwise the list of media files being reproduced by the screen are reported.
A cursor ( ) is shown next to the active screen (the active screen is the device the control unit is currently
communicating with).
If some trouble occurred while communicating with a screen, then the correspondent entry in the list is
shown in red. In case of troubles the screens icon in the status bar also gets flashing red.
The the icon corresponding to a sign is pale gray then the screen has been disabled.
Screens are periodically polled by the control unit, in order to recover the proper publication in case of
sudden screen restart. Anyway it is possible to force the system to immediately refresh the publication of
screen by simply pressing “Sync”.
Soft key “Test” toggles the screens test mode. While in test mode, screens are commanded to publish a
default page (usually reporting the IP address of the screen itself and eventually other info; the actual page
being published depends on the configuration of the screen). Test mode, if active, is automatically
terminated while leaving the screens diagnostics page.
It is also possible to get detailed information about a screen (if supported by the device) by clicking on the
correspondent line (Figure 60).