9 Data Analysis
GC Image Basic Information
2D-LC User Guide 268
MS Data
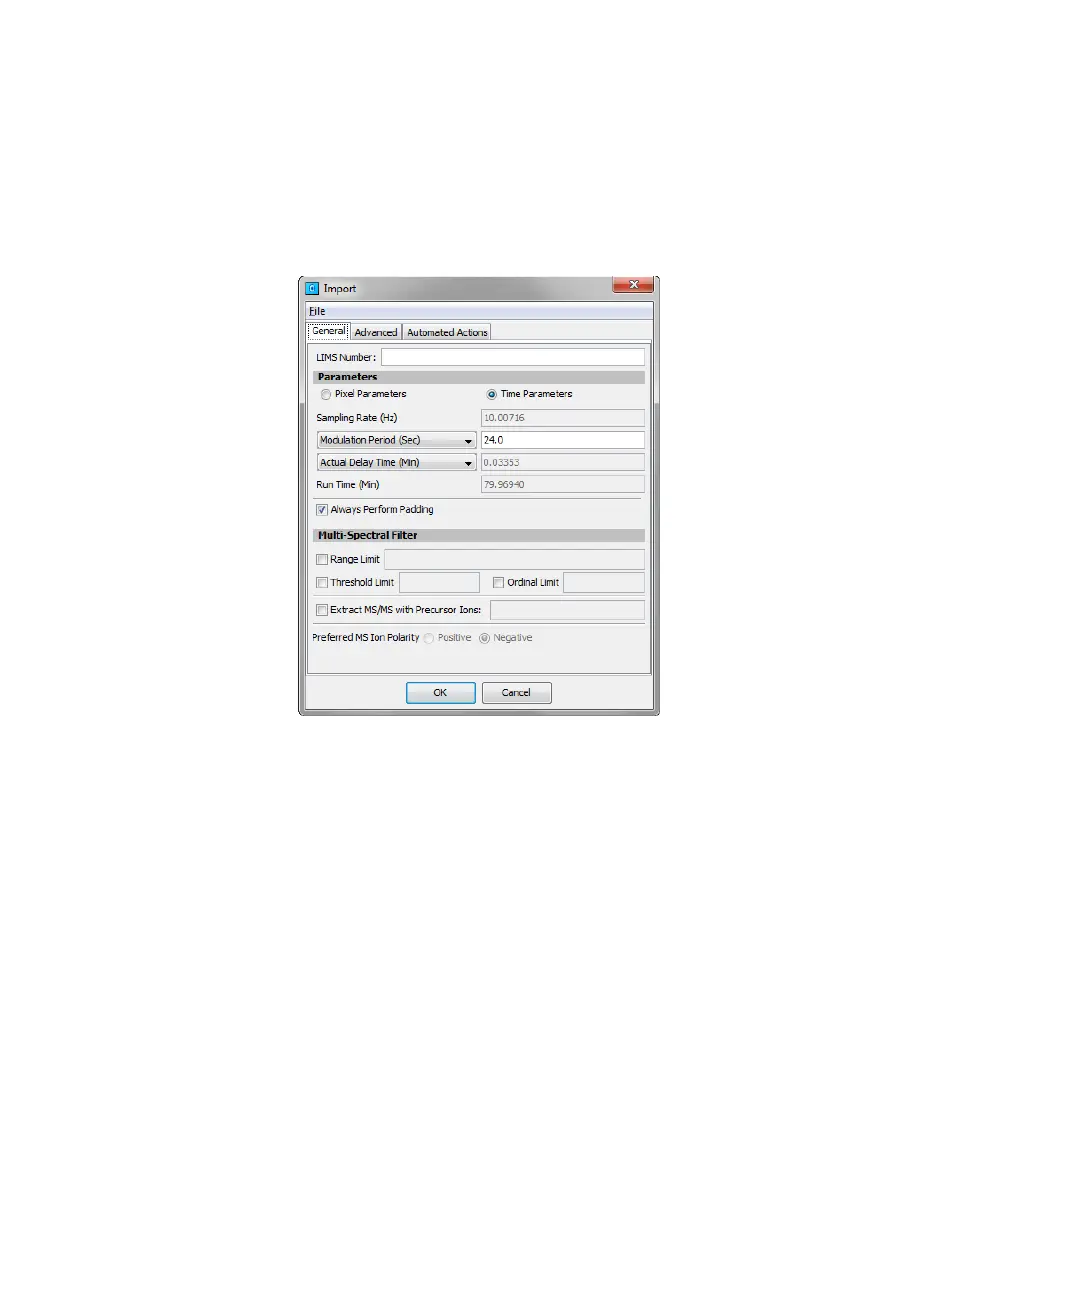
1 Import MS data: The import functionality of MS data is very similar to those of
UV measurements. Additionally, you can for example filter to a certain mass
range („range limit“), that you are interested in.
2 By clicking on „Show 1D view“, you can display the TIC for that 2D slice.
3 By clicking on data points or blobs in the 2D view, you can display MS spectra
of corresponding plots.

 Loading...