7. View the constellation and eye diagram:
Press [
Display
], [
2 grids
],
Press [
A
], [
Measurement Data
], [
IQ measured time
]
Press [
Data Format], [polar (IQ) constellation].
Press [
B
], [
Measurement Data
], [
IQ measured time
]
Press [
Data Format], [eye diagram I].
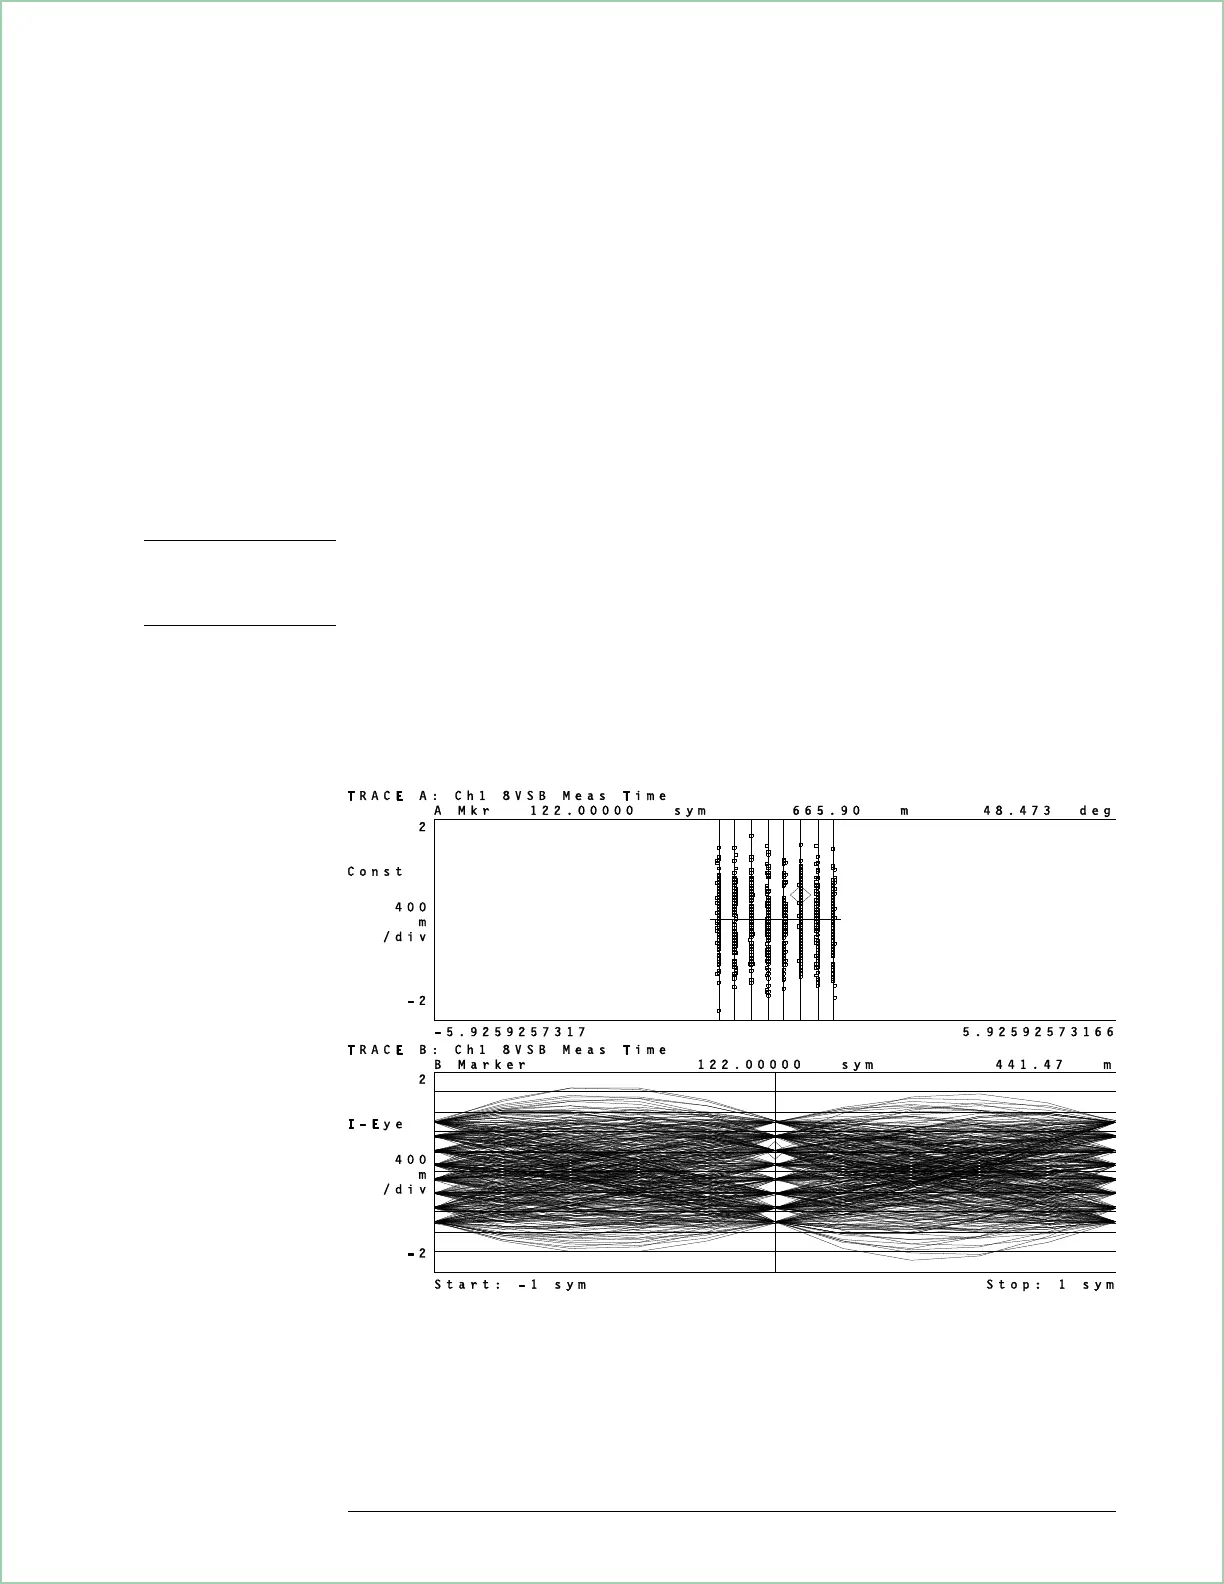
With VSB signals, symbol locations (detection decision points) are derived
from the real portion (I) of the demodulated data. This is evident in the
constellation diagram where you see symbols aligned vertically in 8
locations (16 locations for 16 VSB) along the I-axis. The vertical lines in
the constellation diagram indicate ideal symbol locations.
Hint Displayed data must contain real data to see symbol locations for VSB signals.
For example, if you press
[
Data Format
] and select the imaginary part of the data
or the Q eye-diagram, you won’t see symbol information.
Constellation and eye diagram for 8 VSB signal
Using Video Demodulation
(Opt. AYH)
9 - 7
 Loading...


