To select measurement and display features
You can display demodulated data in many different formats. This task
uses the demodulated 32 DVB QAM signal from the previous task to show
you just a few ways of viewing demodulated data.
1. Select multiple display grids:
Press [
Display
], [
4 grids quad
].
2. Change the data format for trace A:
Press [
A
], [
Data Format
], [
polar IQ constellation
].
3. Change the measurement data for trace B:
Press [
B
], [
Measurement Data
], [
error vector time
].
4. Scale traces A, B, and C:
Press [
Shift], [A], [Shift], [C] to activate traces A, B, and C.
Press [
Auto Scale].
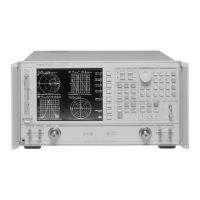
By default, selecting 4 grids displays the current trace in trace A, the
error-vector trace in trace B, the eye diagram in trace C, and the symbol
table in trace D. Thus you can view demodulated data in four different
ways at the same time.
You can change the [
Measurement Data
] and [
Data Format
] for any trace.
Simply activate the trace (for example, press [
A] to activate trace A), then
select the desired measurement data and data format.
Each grid shows a different measurement type with an appropriate data format.
Using Video Demodulation
(Opt. AYH)
9 - 12

 Loading...


