To examine symbol states and error summaries
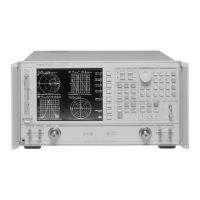
This task shows you how to display the symbol table, which contains
demodulated bits and numeric error information. This task also shows you
how to couple the marker in the symbol table to the constellation diagram
so you can see the bits that correspond to a state. This task is a
continuation of the previous task.
1. Select two display grids:
Press [
Display
], [
2 grids
].
2. Display the symbol table in the upper grid:
Press [
A
], [
Measurement Data
], [
symbol table/error summary].
3. Display a constellation diagram in the lower grid:
Press [
B
], [
Measurement Data
], [
IQ measured time
]
Press [
Data Format
], [
polar IQ constell ation
].
4. Turn on symbol dots on the constellation display:
Press [
more format setup
], [
symbol dots
]
5. Press [
Auto Scale
].
6. Couple the markers on the two grids:
Press [
Marker
], [
couple mkrs on
].
7. Rotate the knob to move the marker from symbol to symbol in both the symbol
table (trace A) and the constellation diagram (trace B).
8. Turn on averaging to observe averaged numeric error data:
Press [
Average
], [
average on].
9. Turn averaging off before continuing to other tasks.
Press [
average off
].
Display online help for more information on these keys and topics.
Analyzing Digitally Demodulated Signals (Options AYA and AYH)
10 - 8

 Loading...


