To view error displays
This task shows you how to view several different error displays, such as
the error-vector magnitude (EVM), magnitude error, and phase error at
each symbol point. This task is a continuation of the previous task.
1. Select four grids:
Press [
Display
], [
4 grids stack
].
2. Select the symbol table/error summary for the top grid:
Press [
A
], [
Measurement Data
], [
symbol table/error summary
].
3. Select an error vector display on trace B:
Press [
B
], [
Measurement Data
], [
error vector time
]
Press [
Data Format
], [
magnitude linear
].
4. Select an error magnitude display on trace C:
Press [
C
], [
Measurement Data
], [
IQ error mag
]
Press [
Data Format
], [
part real
].
5. Select an error phase display on trace D:
Press [
D
], [
Measurement Data
], [
IQ error phase]
Press [Data Format
], [
phase wrap
].
6. Activate the three lower traces and scale them:
Press [
D
], [
Shift
], [
C
], [
Shift
], [
B
].
Press [
Auto Scale].
7. Format the display to show bars only at the decision points:
Press [
Data Format
], [
more format setup
], [
symbols bars
]
Press [
Time
], [
points/symbol
], 1, [
enter
], [
Auto Scale
].
8. Rotate the knob to view errors at the decision points.
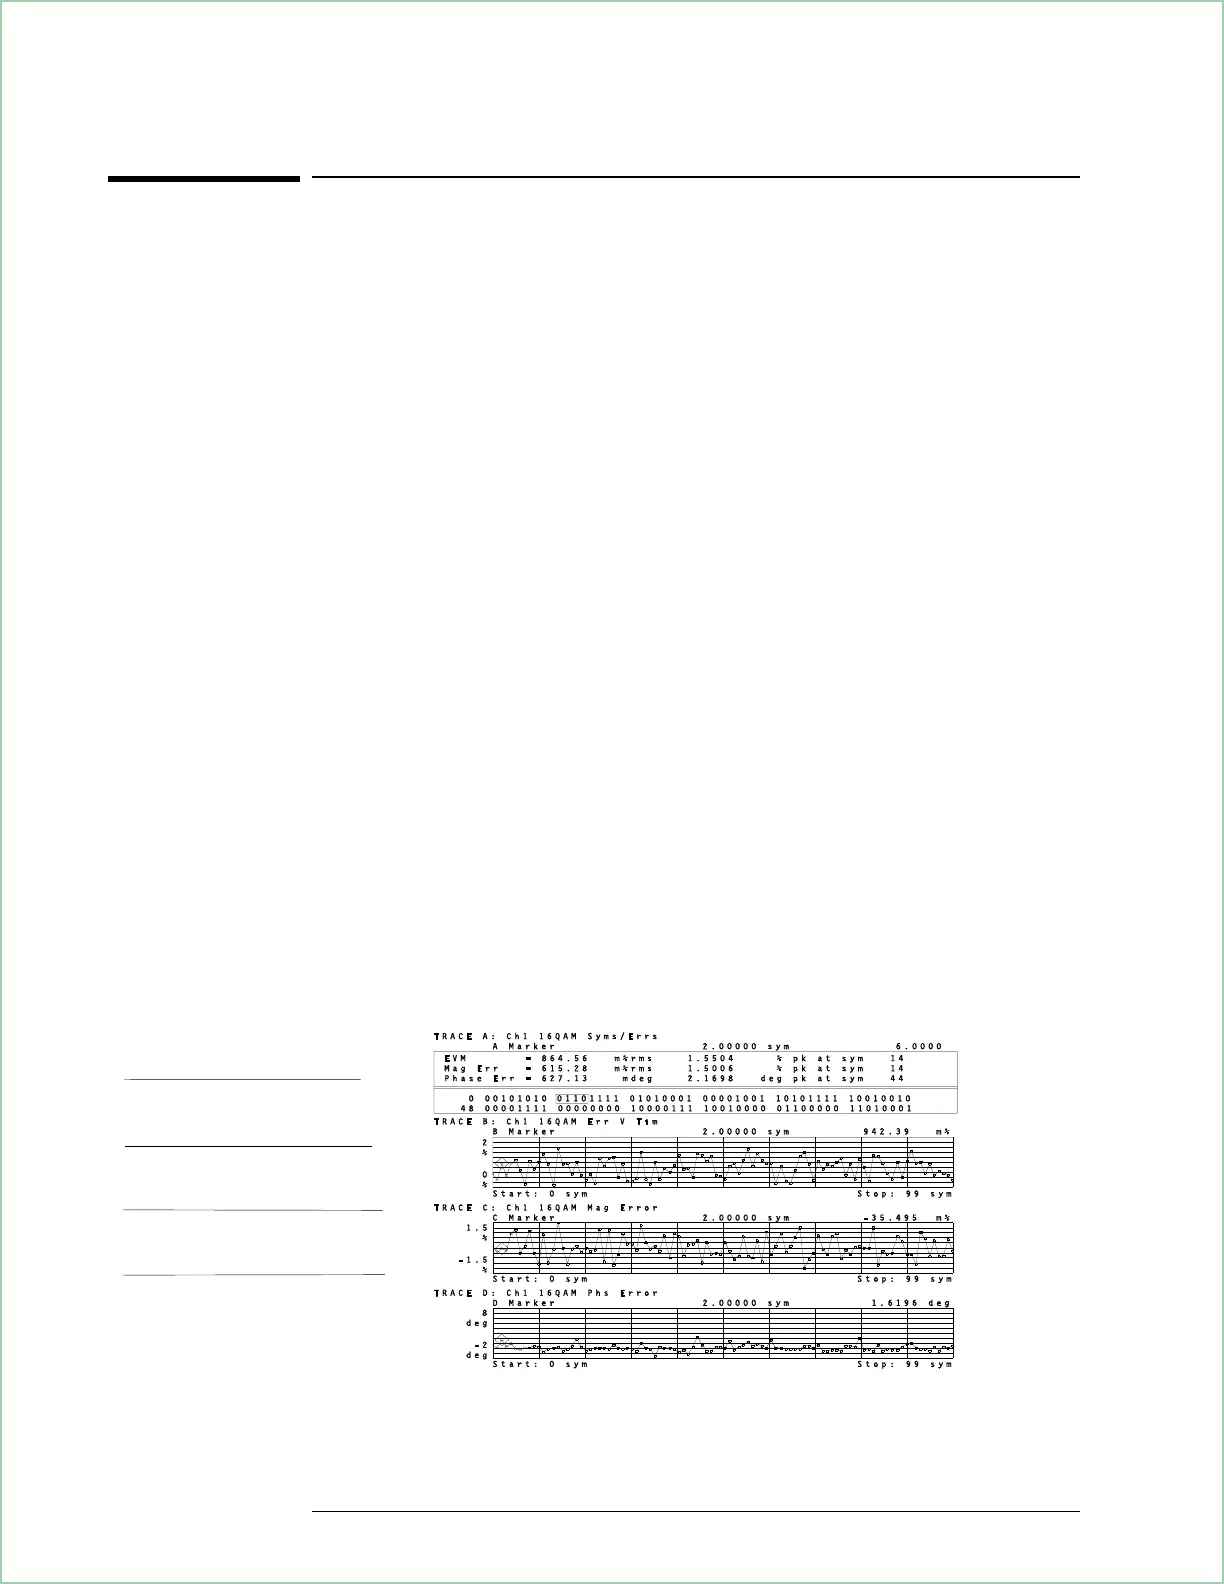
Use multiple grids to view error with various measurement data and data formats.
The combined error vector
magnitude of all decision points.
The error vector magnitude
of each decision point.
The magnitude error of each
decision point.
The phase error of each
decision point.
Analyzing Digitally Demodulated Signals (Options AYA and AYH)
10 - 12

 Loading...


