1. Select PM demodulation:
Press [
Instrument Mode
], [
Analog Demodulation
] (with option AYH, press [
Instrument
Mode
], [demod type], [Analog Demodulation], [Return]).
Press [
demodulation setup
], [
ch1 result
], [
PM
].
2. Select PSD measurement data:
Press [
Measurement Data
], [
PSD
]([
PSD ch1
] for a 2-channel analyzer).
3. Set the x-axis scale to log:
Press [
Data Format
], [
x-axis log
].
4. Turn on averaging:
Press [
Average
], [
average on
], [
num averages
], 100, [
enter
], [
fast avg on
].
5. Run (or start) the measurement and scale the results:
Press [
Meas Restart
] to make the measurement.
Press [
Auto Scale
] to scale the trace data.
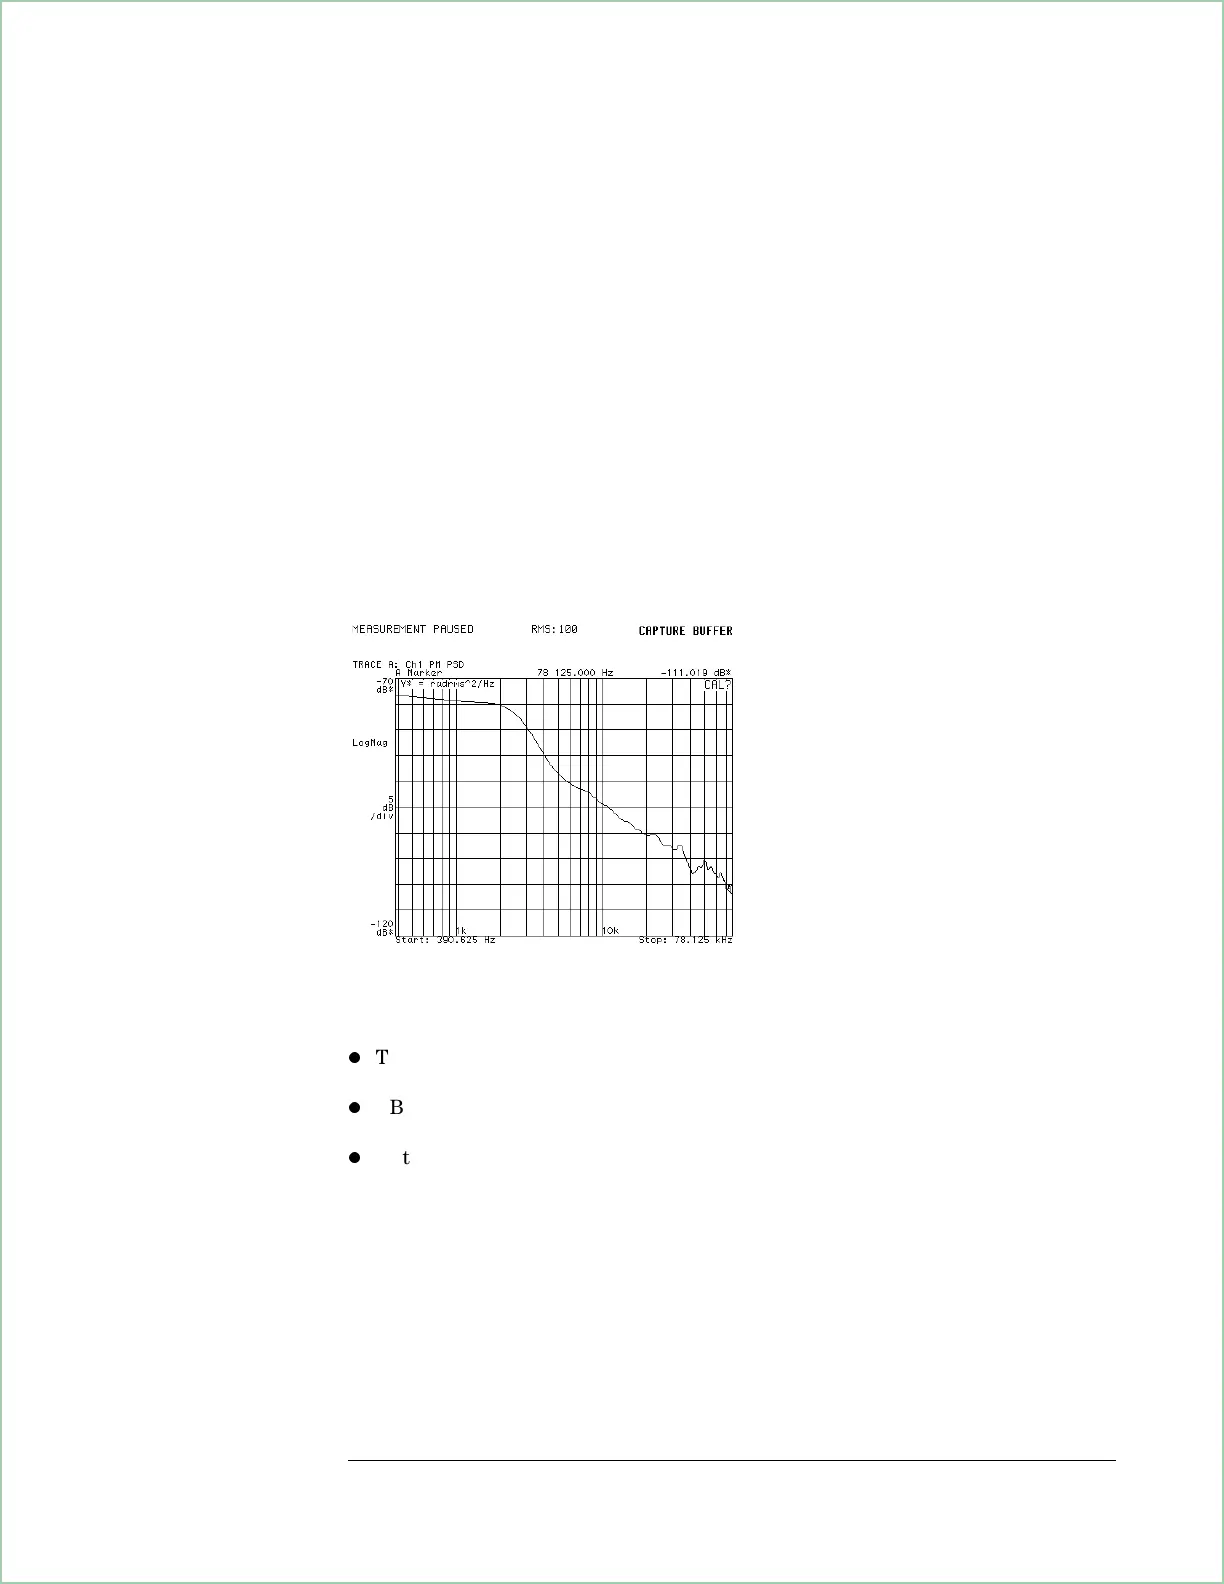
The display should now appear as shown below.
Phase Noise Plot
Special Considerations for phase noise measurements:
l
This is a measurement of S
0
which is defined as the power in both sidebands of
the phase noise. L
(f)
is typically defined as the power in one sideband.
l
RBW must be small enough so that the low frequency portion of the log X-axis is
valid. RBW should be less than the start frequency.
l
Note that the span in demodulation mode is one-half the span of the instrument.
Measuring Phase Noise
2-3