To select measurement and display features
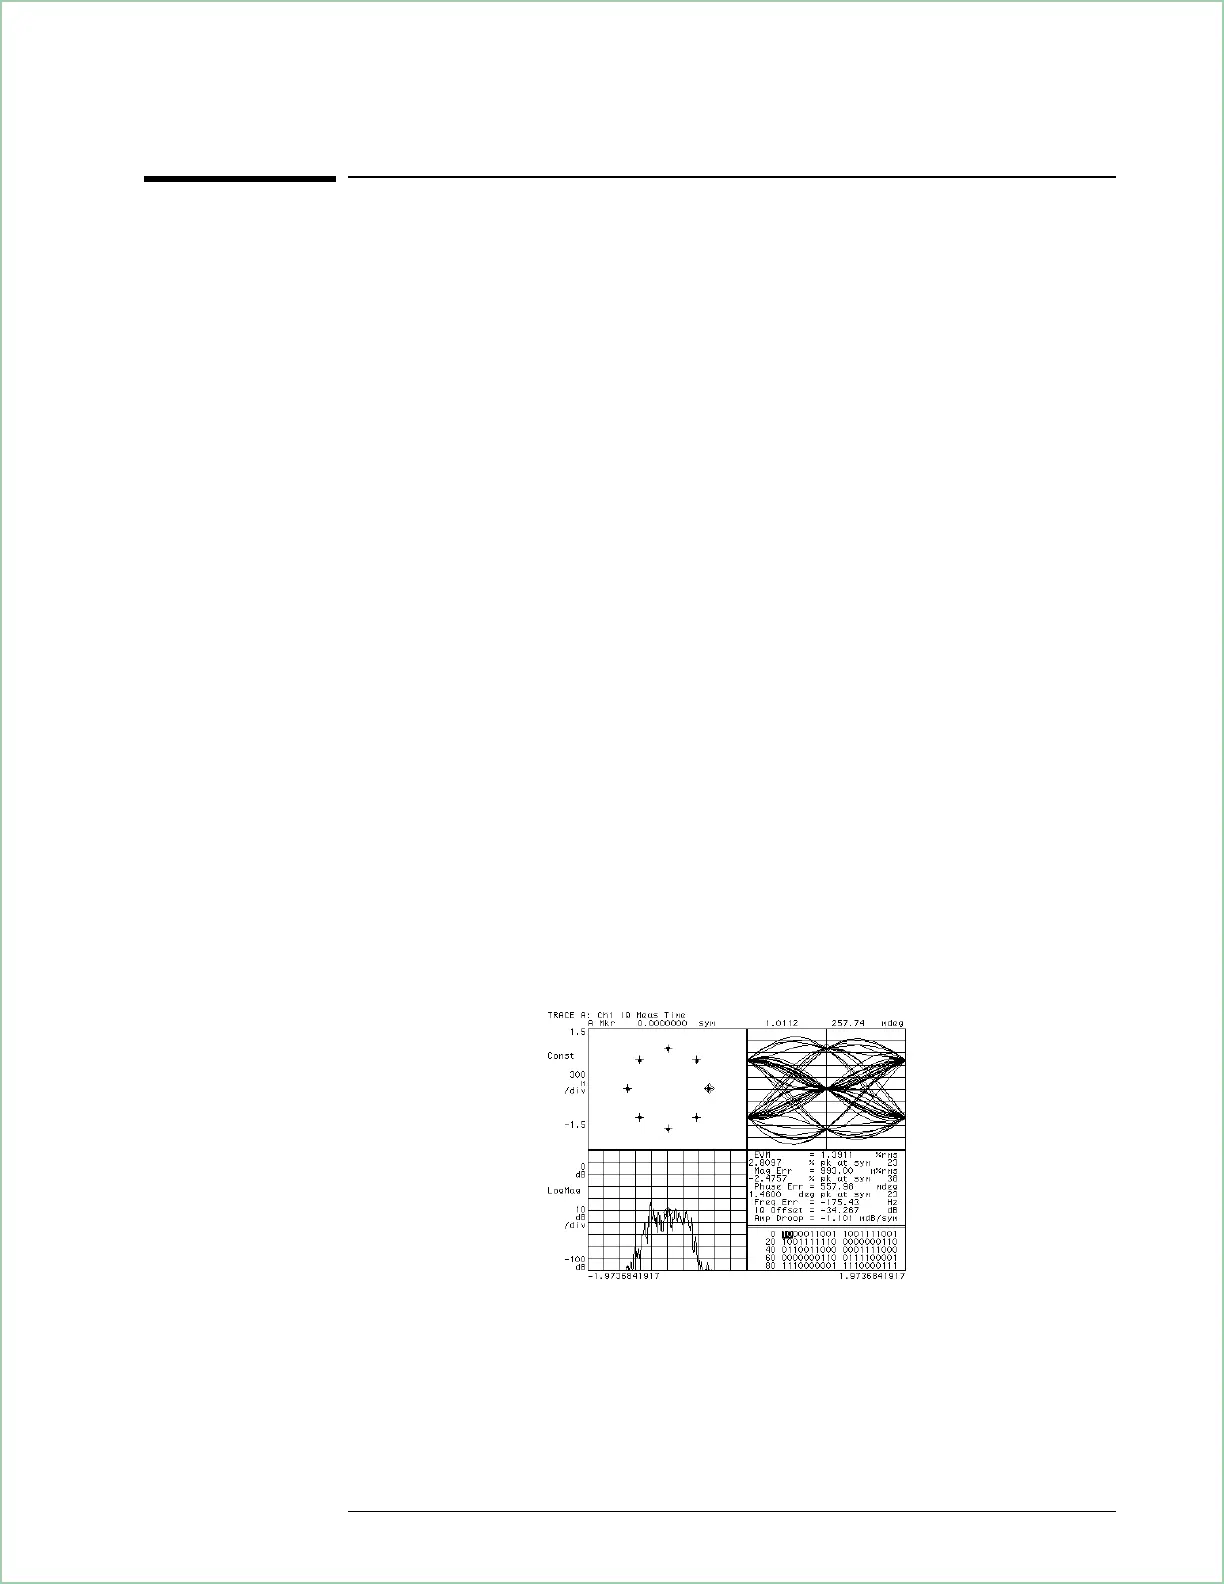
The analyzer provides many different ways of viewing demodulated data.
This task shows you how to display demodulated data two different views
in two grids.
1. Demodulate your signal as shown in the previous task.
2. Select multiple display grids:
Press [
Display
], [
4 grids quad
].
3. Change the measurement data for trace B:
Press [
B
], [
Measurement Data
], [
error vector spectrum
]
4. Change the data format for trace A:
Press [
A
], [
Data Format
], [
polar IQ constell ation
].
The [
Measurement Data
] menu allows you to select the type of data you want
to see, while the [
Data Format
] menu selects how you want to display that
data. You may select different measurement data and data formats for up
to four traces by activating each trace individually.
Each grid shows a different measurement type with an appropriate data format.
Using Digital Demodulation (Opt. AYA)
8 - 5