To demodulate and analyze an EDGE signal
This task shows you how to demodulate an EDGE (Enhanced Data rates
for GSM Evolution) signal. The EDGE signal used in this task was
generated with the HP/Agilent E4433 ESG Series Signal Generator, with a
frequency of 5 MHz, amplitude of 0 dBm, and a framed (pulsed) data
format. Option B7A must be installed to demodulate EDGE signals.
1. Initialize the analyzer:
Press [
Instrument Mode
], [
receiver
], then press:
89410A: [
input section (0-10 MHz)
].
89441A: [
RF section (0-10 MHz)
].
Press [
Preset
].
2. Connect your EDGE signal to the channel 1 INPUT.
3. Set the center frequency (this example uses a 5 MHz EDGE signal):
Press [
Frequency
], [
center
], 5, [
MHz
]
4. Select the optimum range:
Press [
Range
].
Press the down-arrow key until the Channel-1 Over and Half LEDs are on.
Press the up arrow key one press at a time until the Over LED turns off.
For additional details about selecting the optimum range, see online help
for the [
Range], [ch1 range] softkey.
5. Turn on digital demodulation:
Press [
Instrument Mode
], [
Digital Demodulation
] (with option AYH, press
[
Instrument Mode
], [
demod type
], [
Digital Demodulation
], [
Return].)
6. Configure the analyzer to demodulate the EDGE signal:
Press [
demodulation setup
], [
demod format
], [
standard setups
], [EDGE].
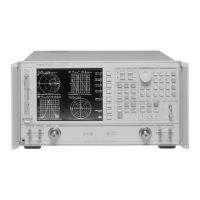
7. Display four grids to view the vector diagram (trace A), error-vector trace
(trace B), eye diagram (trace C), and symbol table (trace D).
Press
[Display
], [
4 grids quad
].
8. Autoscale traces A, B, and C:
Press
[Shift] [
B
], [
Shift
][
C
]
Press
[Auto Scale].
Using Digital Demodulation (Opt. AYA)
8 - 10

 Loading...


