9. Display the ideal vector diagram in trace C and compare it to trace A:
Press [
C
], [
Measurement Data
], [
IQ reference
time
]
Press [
Data Format
], [
polar IQ vector
]
Press [
more format setup
], [
symbol dots
]
Press
[Shift
][
A
], [Auto Scale].
Selecting the EDGE standard setup automatically sets the demodulation
format, frequency span, symbol rate, filtering, and several other
demodulation parameters (for a complete list, see help for [
standard setups
]).
Because EDGE signals incorporate rotation and the EDGE filter introduces
ISI (inter-symbol interference), symbol locations in the vector and
constellation diagrams should appear random. However, at one
point/symbol (the value set by the EDGE standard setup) the analyzer
removes the effects of ISI so you can view a “clean” vector diagram.
Above one point/symbol, the analyzer does not remove the effects of ISI.
10. Set points/symbol to 2 to view the effects of ISI on the vector diagram:
Press [
A], [Display
], [
single grid
]
Press [
Time
], [
points/symbol
], 2,[
enter
].
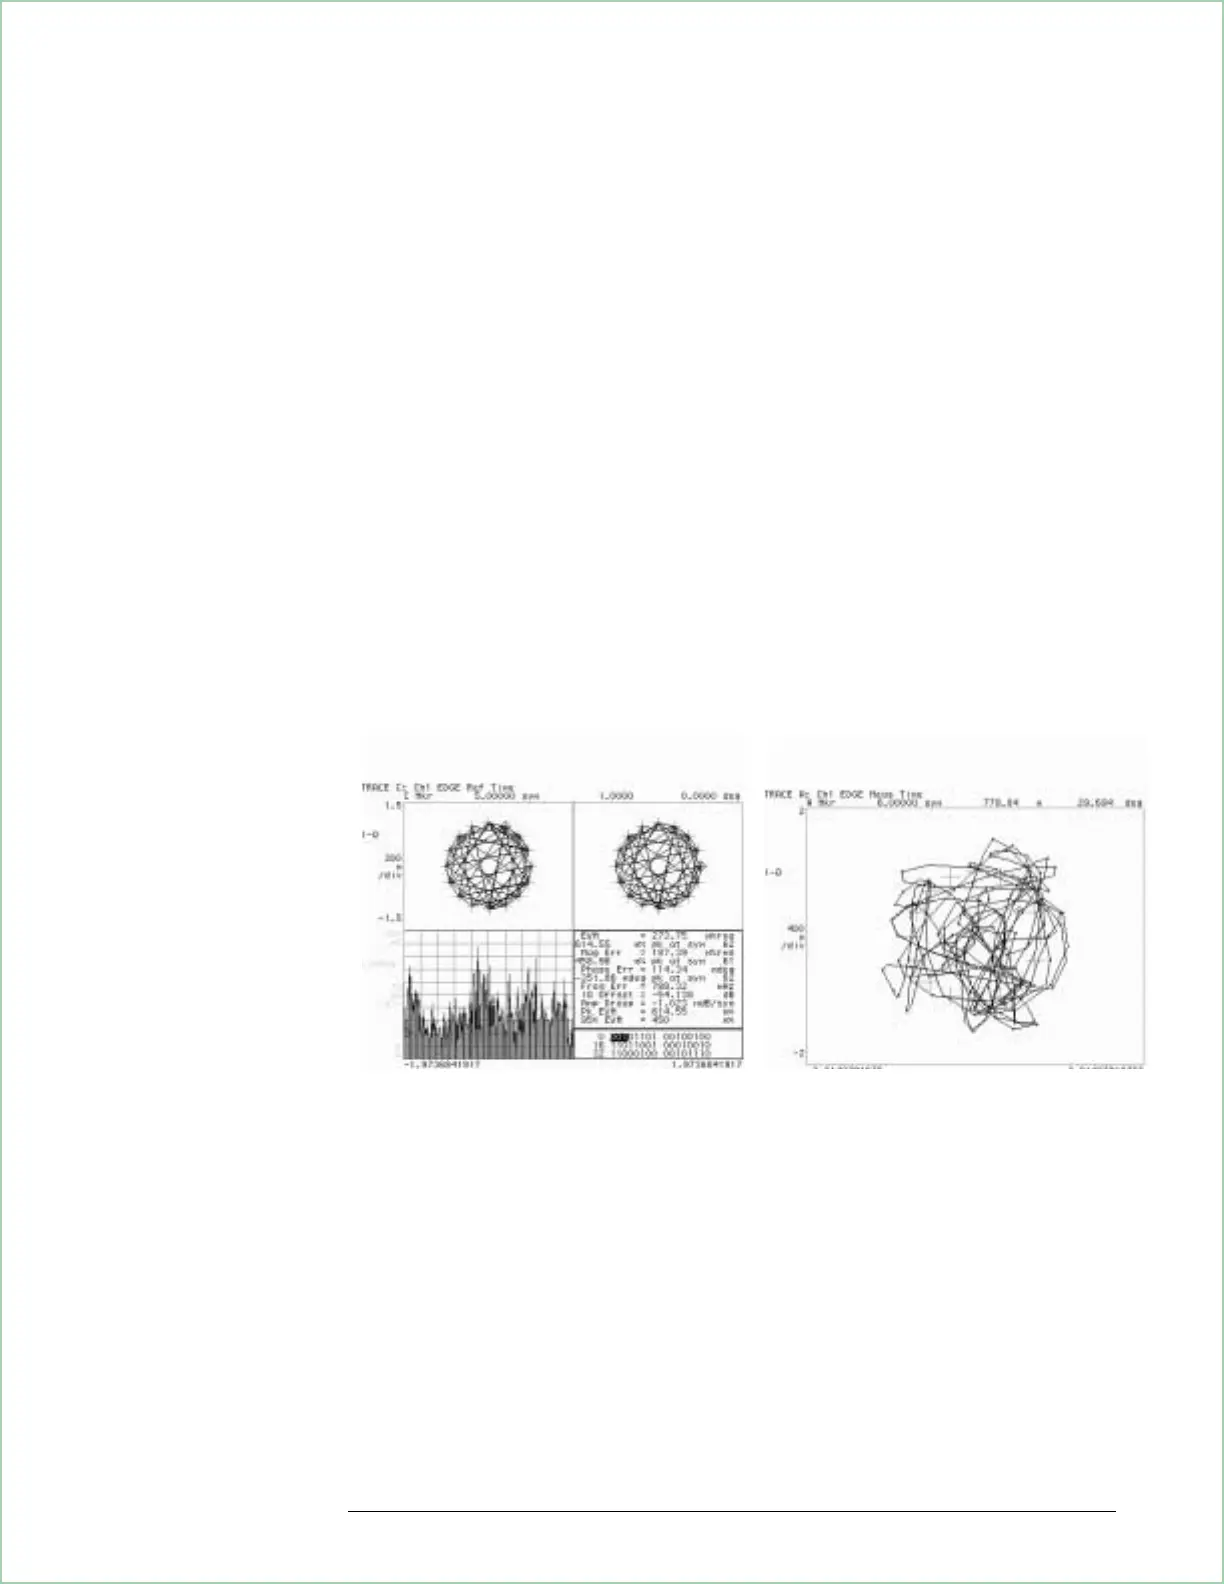
Quad display showing individual IQ measured and IQ reference vector diagrams, the
error vector trace, and the symbol table (at 1 point/symbol). Single display showing
same vector diagram, but at 2 points per symbol. At 1 point/symbol, the analyzer
removes the effects of ISI so you can view a “clean” vector diagram. Above 1
point/symbol, the effects of ISI are not removed.
Using Digital Demodulation (Opt. AYA)
8 - 11