The Y-axis (amplitude)
Time-domain measurements are usually viewed with a linear X-axis and a linear
Y-axis (think of an oscilloscope). Frequency-domain measurements are sometimes
viewed with a linear Y-axis and a linear X-axis, but usually must be viewed with a
logarithmic Y-axis, since this is the only way to view very small signals and much
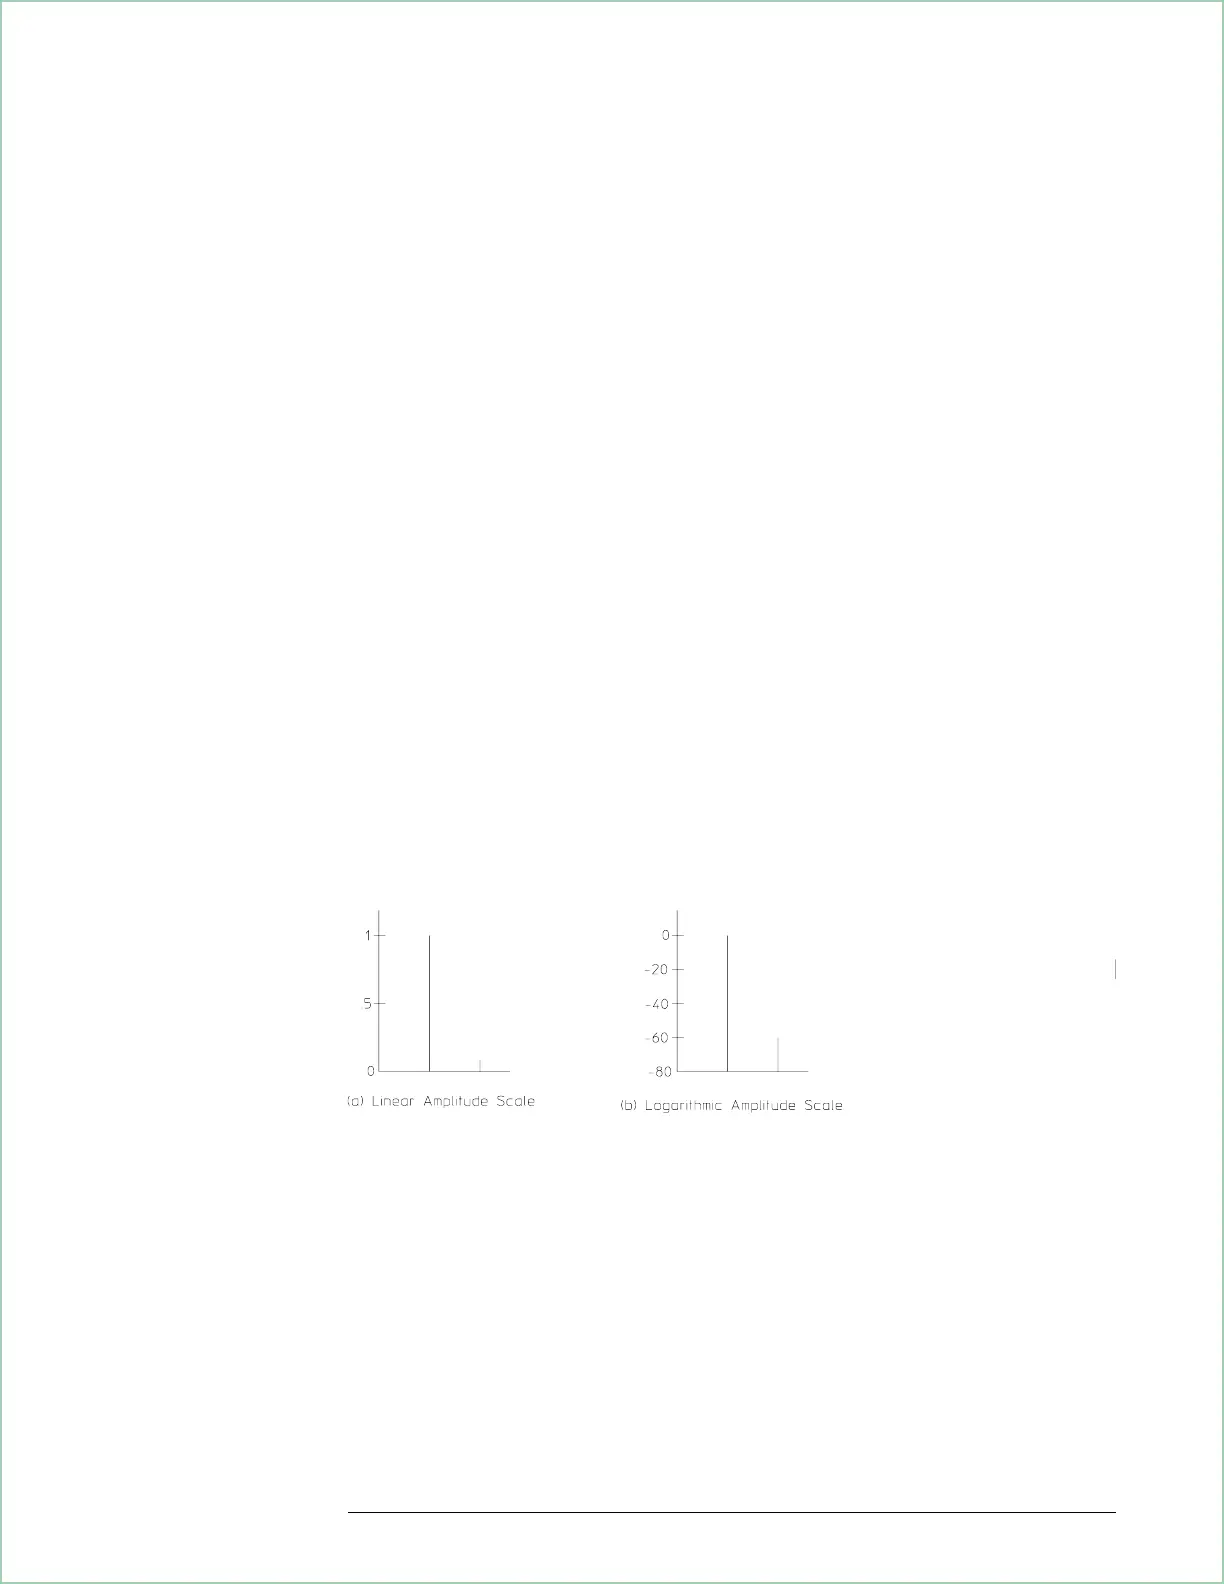
larger signals simultaneously.
Let’s look at the spectrum of a sine wave. Because the amplitude of any harmonic
is small relative to the fundamental frequency, it’s nearly impossible to view a
harmonic on the same display as the fundamental unless the Y-axis scale is
logarithmic. That’s why most measurements made with spectrum analyzers use a
logarithmic amplitude scale—a scale based on decibels. And since the dB scale is
by definition logarithmic, there’s no need to use logarithmically-spaced graticule
lines.
The X-axis (frequency)
Sometimes it’s convenient to use a logarithmic X-axis. Perhaps most familiar to
you is the frequency response measurement. This is traditionally displayed with a
log X-axis (frequency) versus a log Y-axis (relative magnitude).
But most measurements do not require a logarithmic frequency scale. In fact, when
making spectrum measurements it’s easier to characterize harmonics with a linear
X-axis scale since harmonics that are multiples of the same fundamental will
appear at evenly-spaced intervals.
What Makes this Analyzer Different?
18 - 3