FM Demodulation Specifics
The algorithm
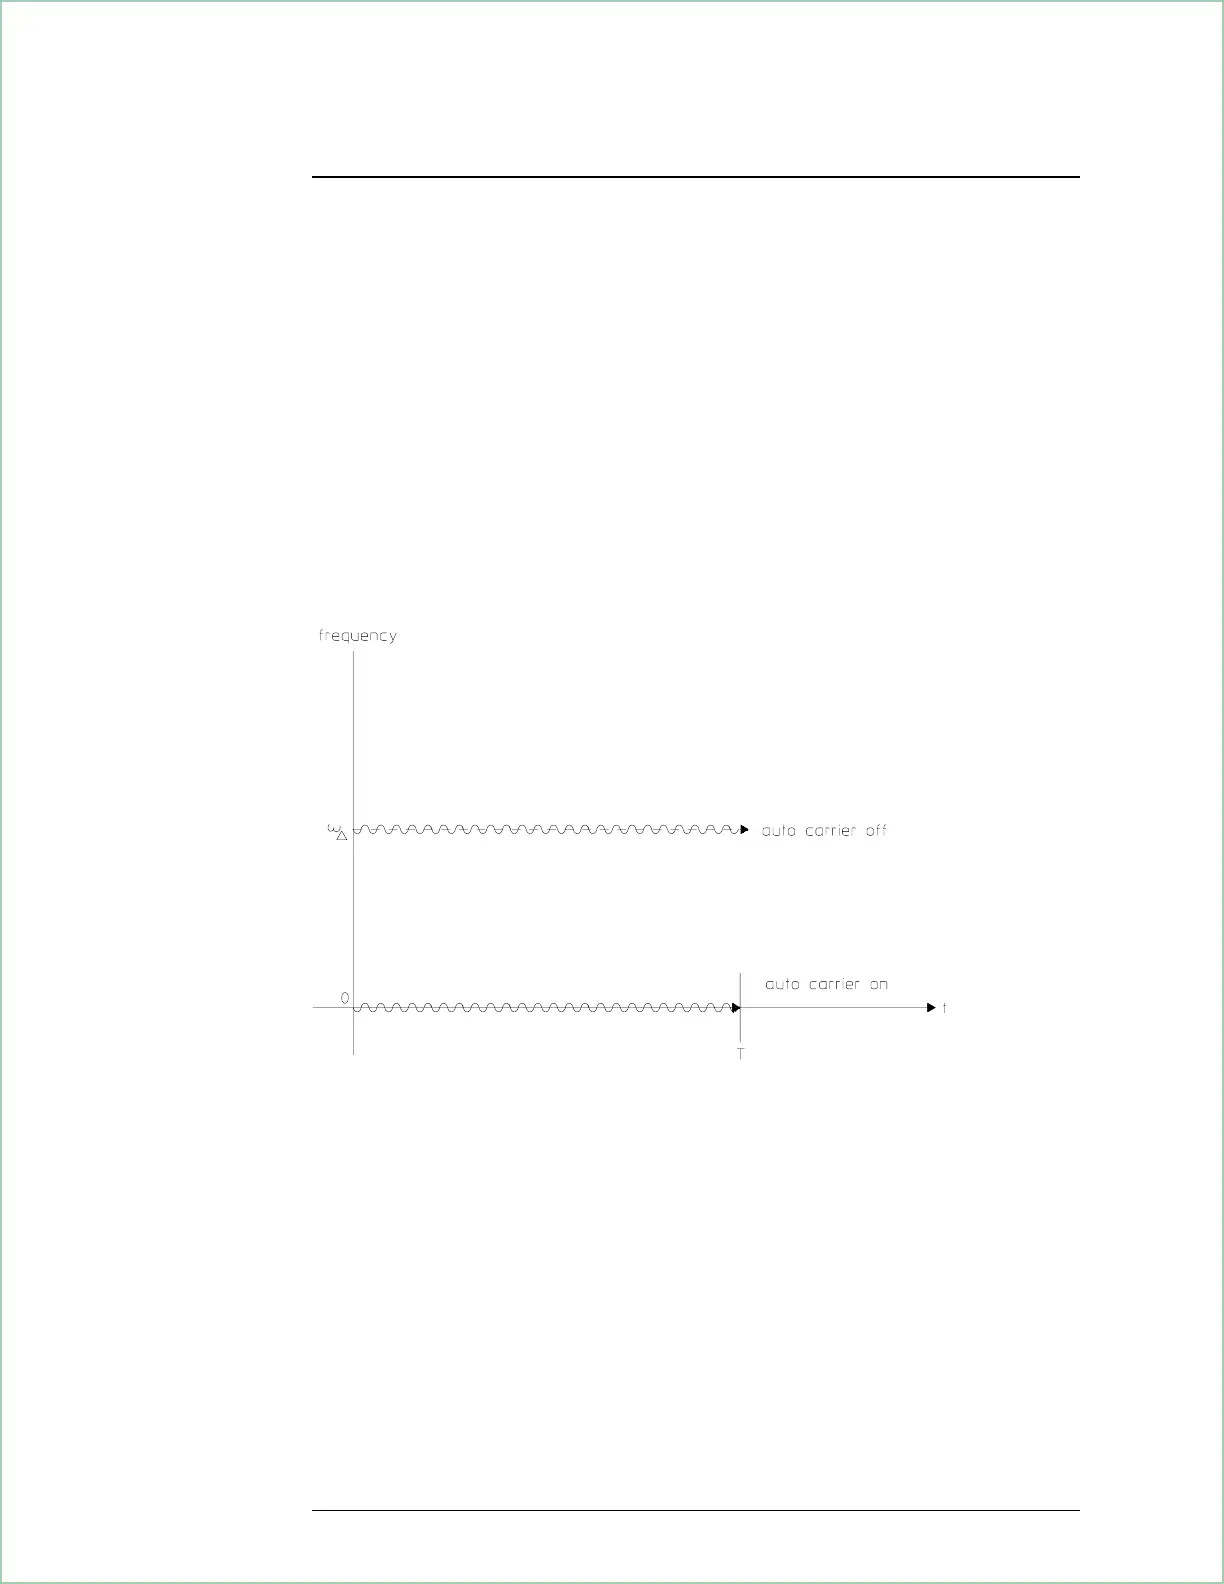
Auto carrier off
FM is the derivative of PM.
Auto carrier on
Since FM is the derivative of PM, phase offset differentiates to 0 and auto carrier
removes only the frequency error, ω∆.
Example of a carrier FM modulated by a sine wave
Analog Demodulation Concepts
20 - 12