Time Domain and Frequency Domain
Measurements
Measurements made in the time domain are the basis of all measurements in this
analyzer. The time domain display shows a parameter (usually amplitude) versus
time. You are probably familiar with time domain measurements as they appear in
an oscilloscope. Similar measurements may be viewed with the time measurement
data capability.
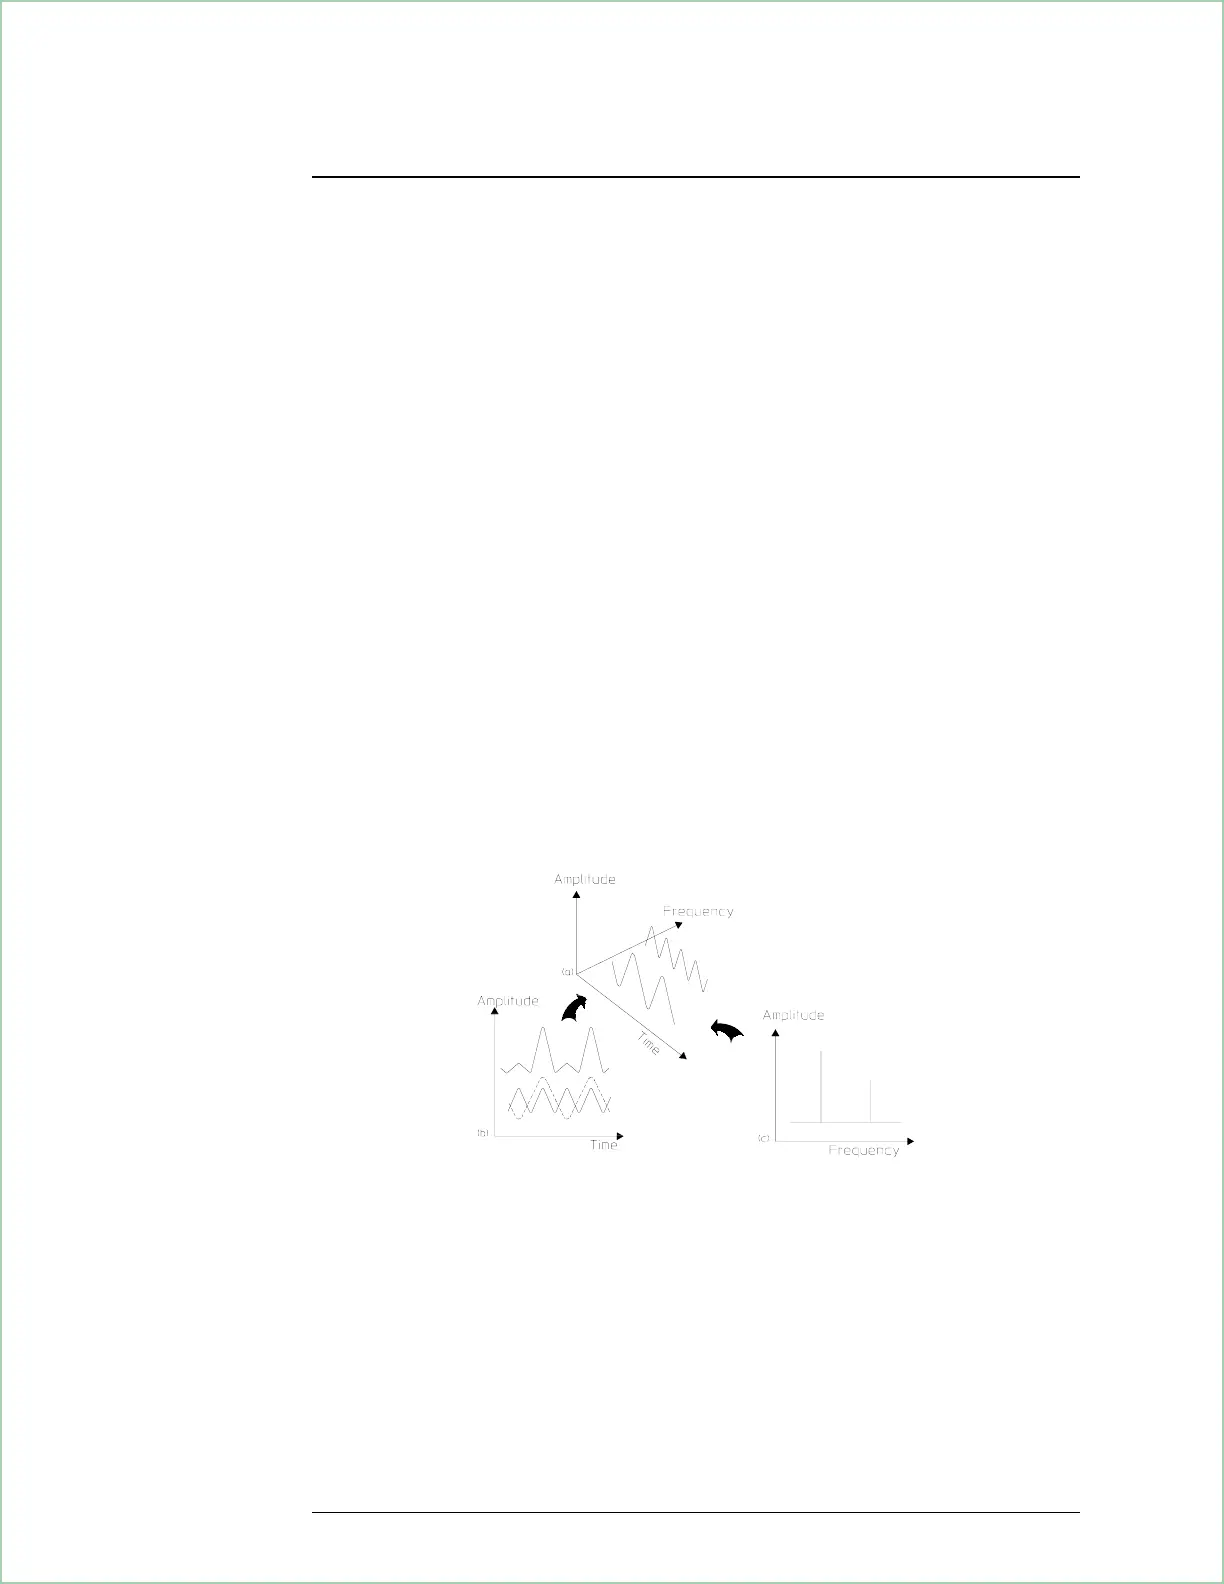
Frequency-domain displays show a parameter (again, usually amplitude) versus
frequency. A spectrum analyzer takes an analog input signal—a time-domain
signal—and converts it to the frequency domain (this conversion can be done in
several ways; we’ll talk about that a little later). The resulting spectrum
measurement shows the energy of each frequency component at each point along
the frequency spectrum.
Many signals not visible in the time domain (such as noise and distortion products)
are clearly visible in the frequency domain. Because spectrum displays show
frequency components distributed along the frequency axis, it’s possible to view
many different signals at the same time. This is why the spectrum analyzer is such
a useful tool for looking at complex signals—it lets you easily measure (and
compare) the frequency and amplitude of individual components.
Notice the difference between the time-domain and frequency-domain
displays of the same input signal.
What Makes this Analyzer Different?
18 - 2