Making Measurements 5
6000 Series Oscilloscope User’s Guide 217
oscilloscope vertical bandwidth when making FFT
measurements. The FFT sample rate is displayed directly
above the softkeys when the FFT menu is displayed.
Aliasing happens when there are frequency components in
the signal higher than half the sample rate. Since the FFT
spectrum is limited by this frequency, any higher
components are displayed at a lower (aliased) frequency.
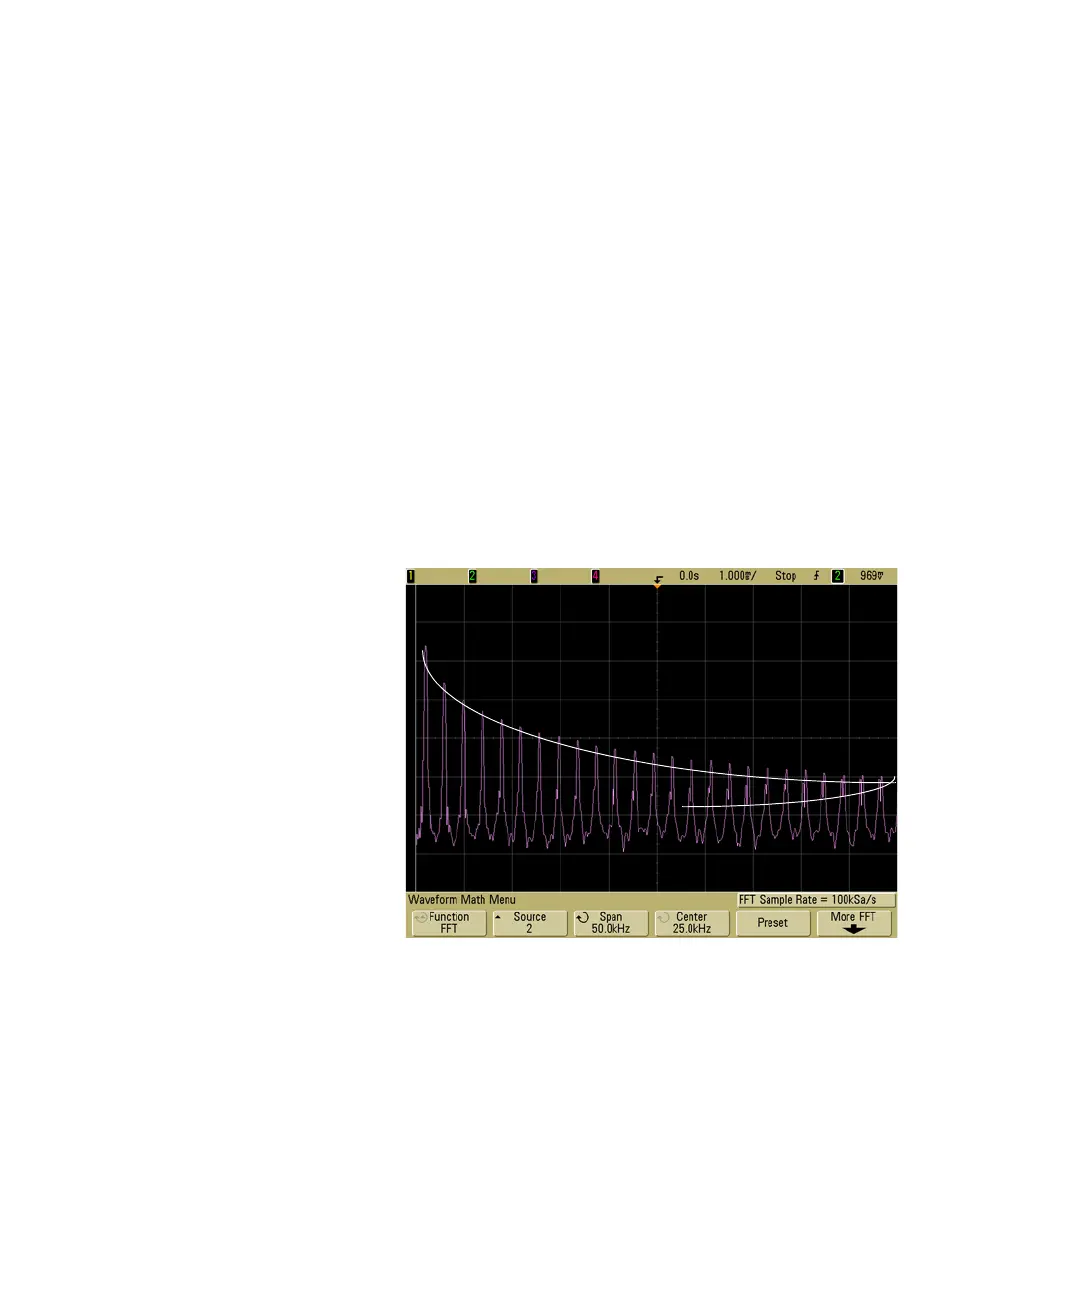
The following figure illustrates aliasing. This is the spectrum
of a 990 Hz square wave, which has many harmonics. The
FFT sample rate is set to 100 kSa/s, and the oscilloscope
displays the spectrum. The displayed waveform shows the
components of the input signal above the Nyquist frequency
to be mirrored (aliased) on the display and reflected off the
right edge.
Figure 31 Aliasing
Since the frequency span goes from ≈ 0 to the Nyquist
frequency, the best way to prevent aliasing is to make sure
that the frequency span is greater than the frequencies of
significant energy present in the input signal.
True frequency component
Aliased frequency component
 Loading...