Cable & Antenna Analyzer MG PN: 10580-00241 Rev. B A-5
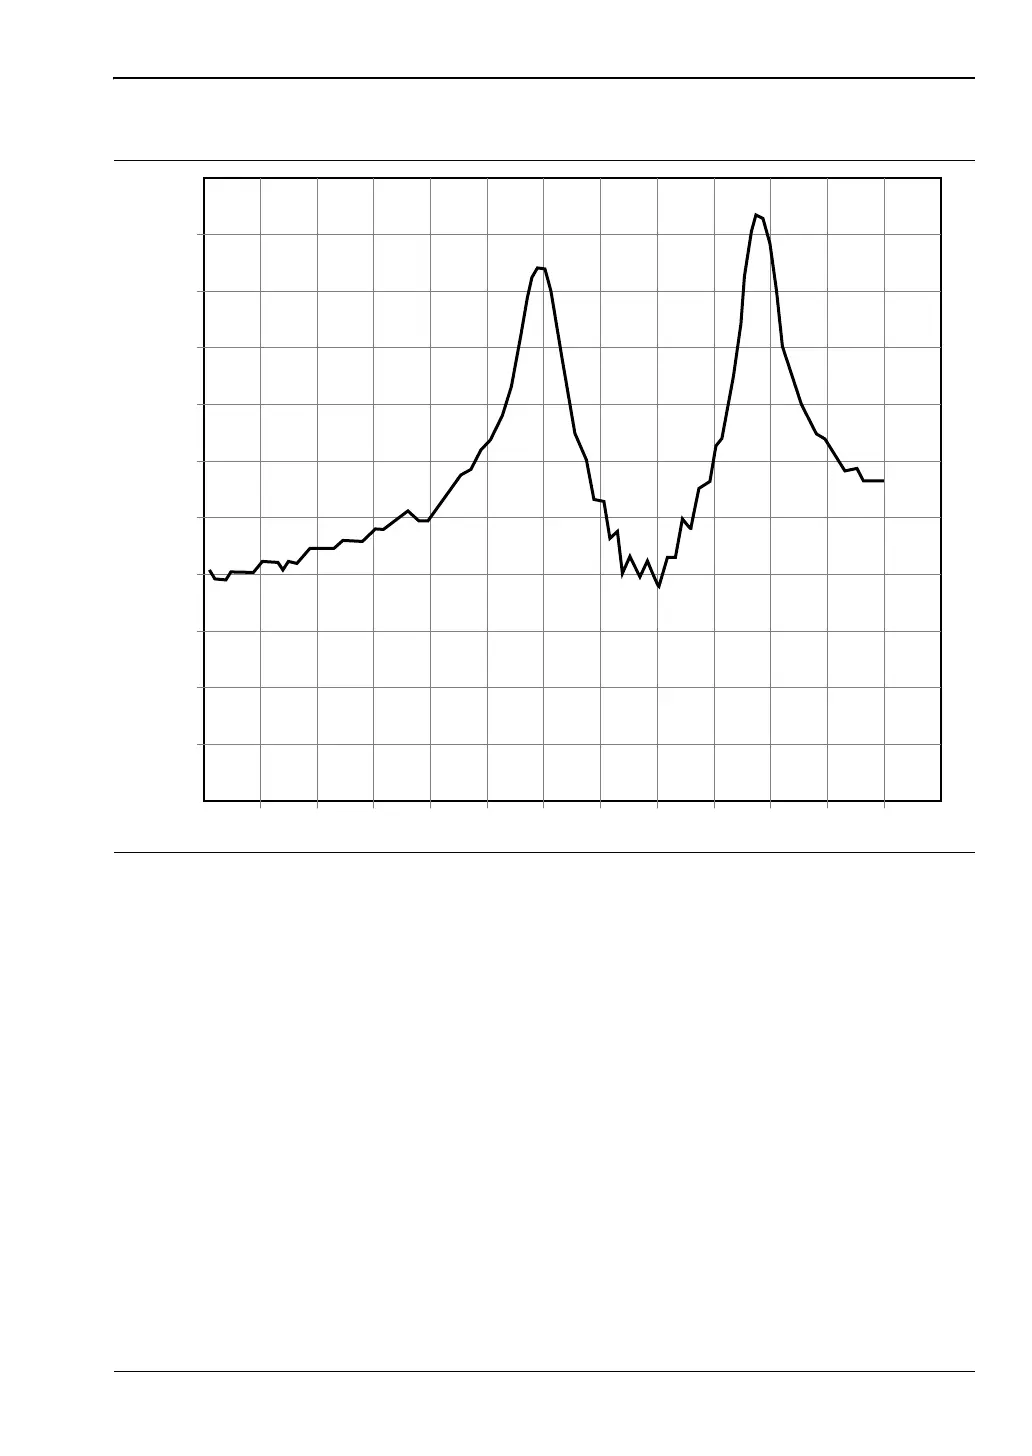
Minimum Side Lobe Windowing
This Distance To Fault graph has Return Loss (dB) on the vertical scale (y-axis) and distance
in feet on the horizontal scale (x-axis).
This view of Minimum Side Lobe Windowing shows less side lobe resolution than Low Side
Lobe Windowing and displays the lowest side lobe and waveform resolution.
Figure A-4. Minimum Side Lobe Windowing Example
–5
–10
–15
–20
–25
–30
–35
–40
–45
–50
5
10
15
20 25 30 35 40 45 50 55 60