www.ayyeka.com | +1 (310) 876-8040 | info@ayyeka.com 23
Understanding the Data Stream Chart
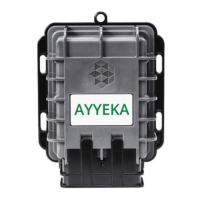
Hovering over a point in the chart displays a tool tip with the following information:
Timestamp
Site name
Type of data stream (such as Pressure, Level, etc.)
The reading
Setting the Time Range
You can set the start and end date for the chart by clicking the Range drop-down and setting the dates.
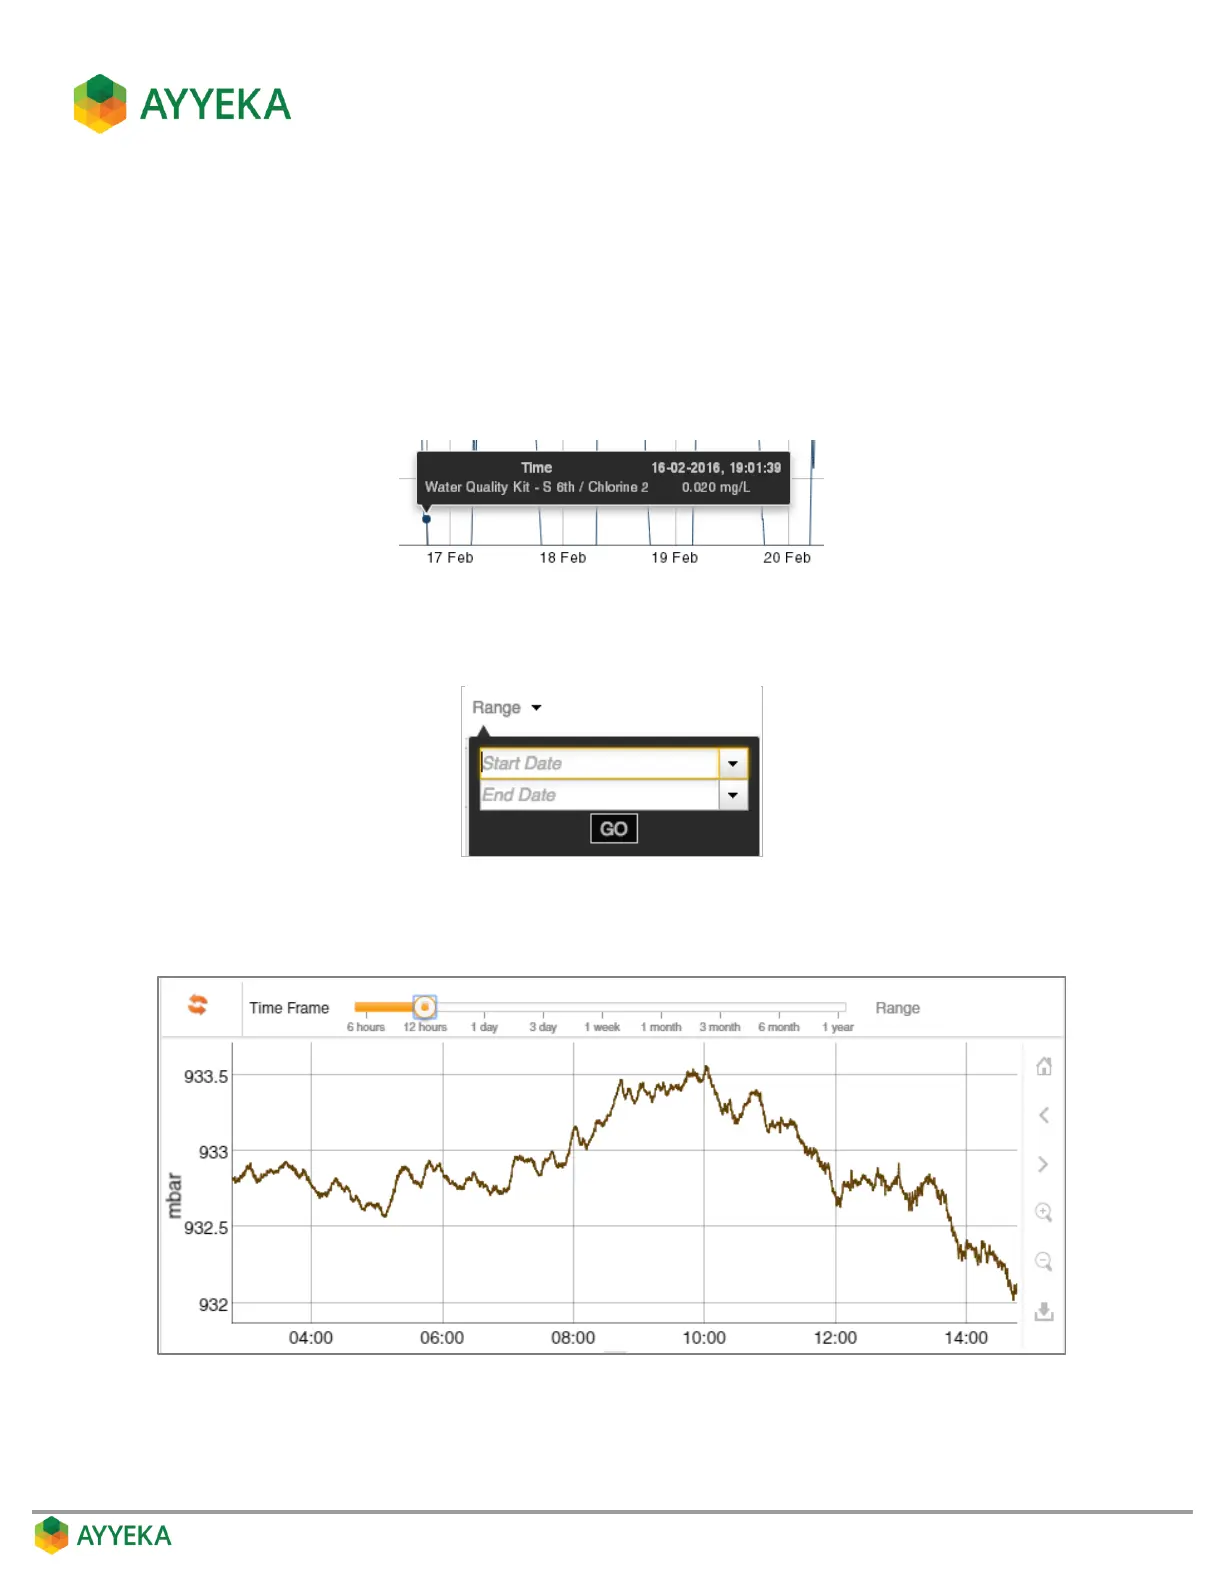
Setting the Time Frame
You can set the time frame shown in the window by selecting the desired time frame in the Time Frame selector.