www.ayyeka.com | +1 (310) 876-8040 | info@ayyeka.com 30
6. Click Save Report Configuration if you wish to save this specific report generation criteria, and enter a
descriptive name for the report type.
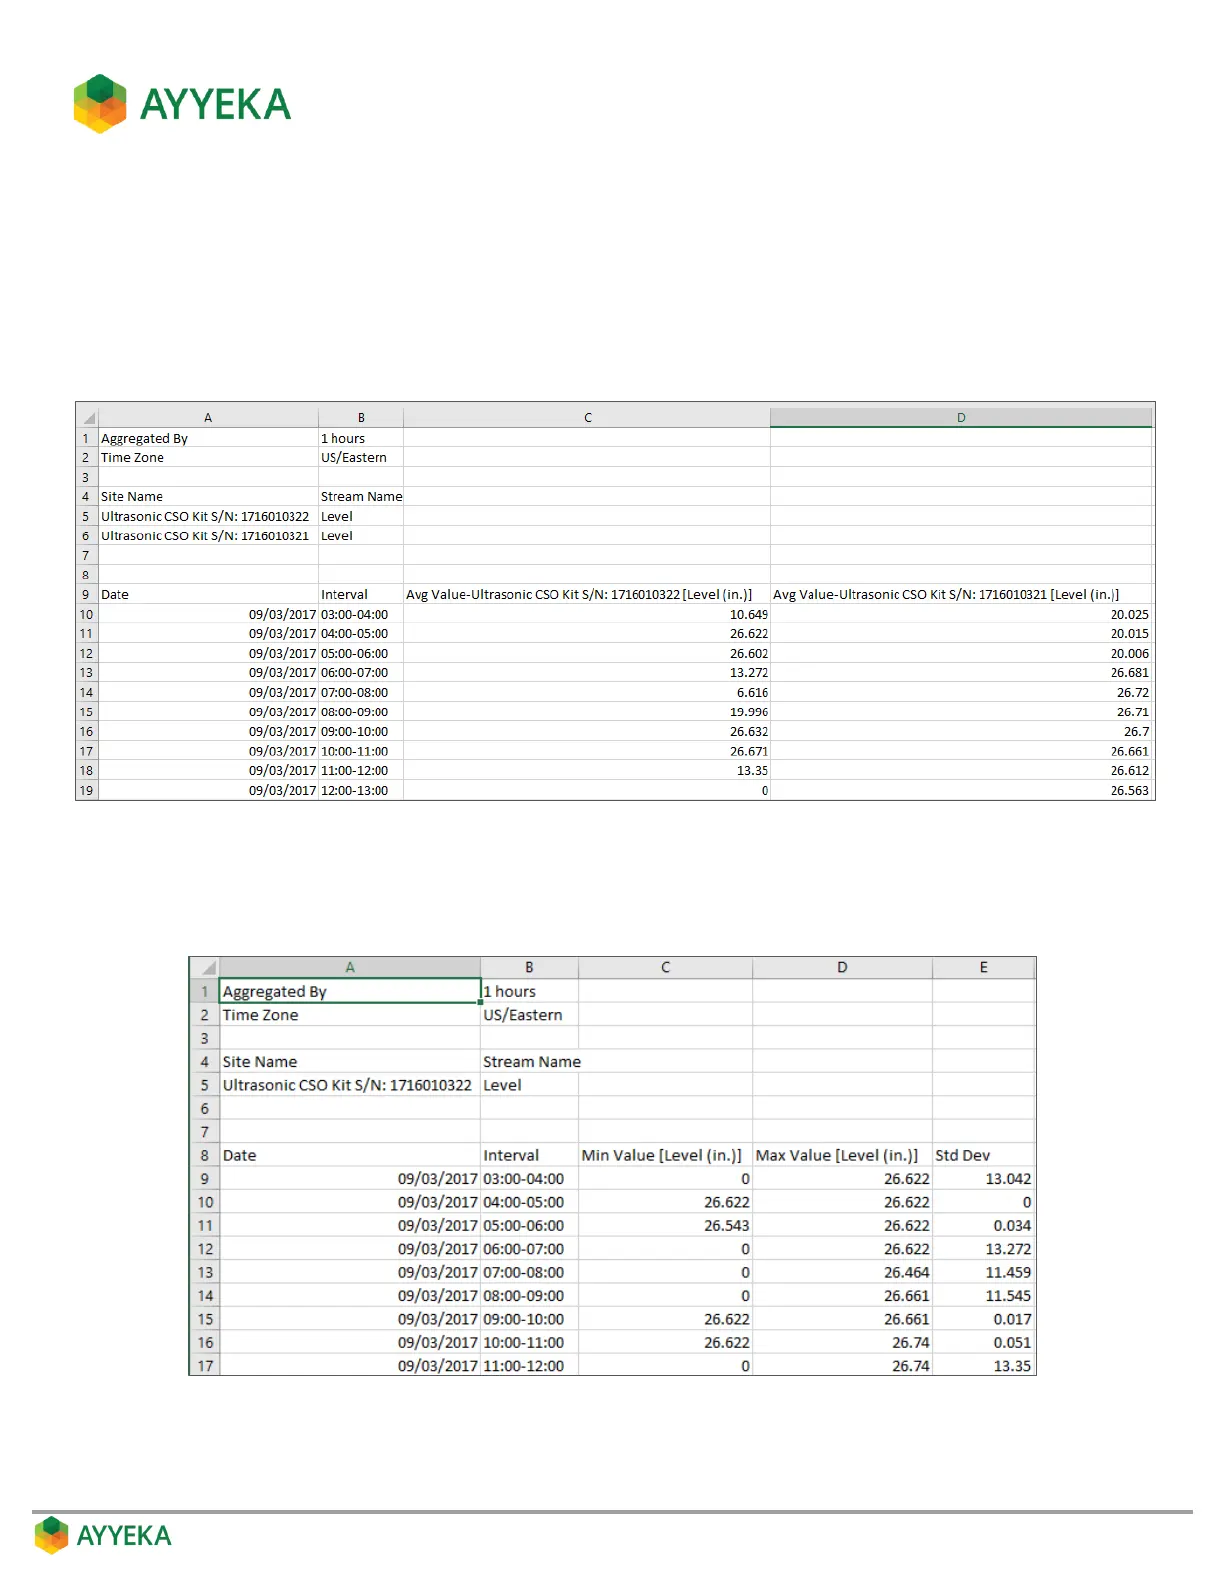
7. Click Export to CSV. A CSV file is created, showing the results of the statistical analysis for the selected
period. For example:
If you had specified two streams, the Average function, and Separate Streams in the report
criteria, the resultant report will look similar to the following:
Figure 15: Aggregation Report – Example for Multiple Streams
If you had specified a single stream, and the Min, Max and Standard Deviation functions in the
report criteria, the resultant report will look similar to the following:
Figure 16: Aggregation Report – Example for a Single Stream