xStack® DGS-3120 Series Layer 3 Managed Gigabit Ethernet Switch Web UI Reference Guide
452
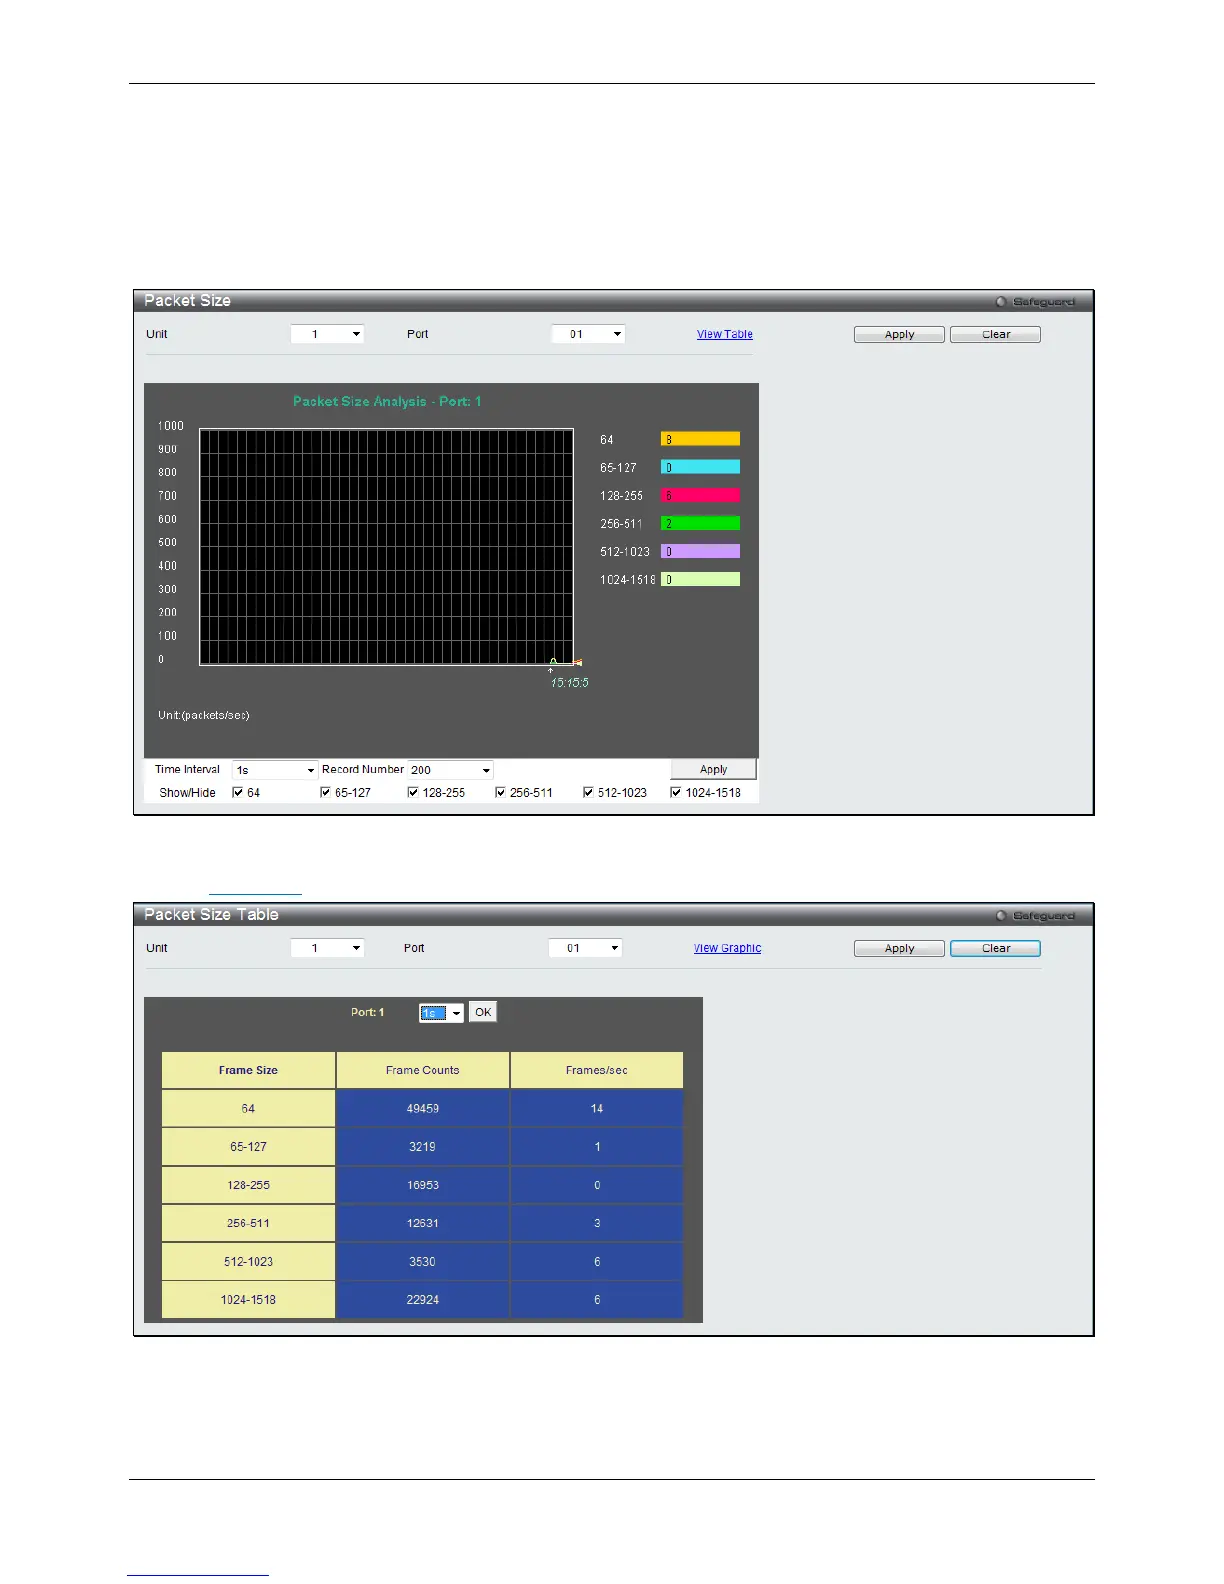
Packet Size
Users can display packets received by the Switch, arranged in six groups and classed by size, as either a line
graph or a table. Two windows are offered. To select a port to view these statistics for, select the port by using the
Port drop-down menu. The user may also use the real-time graphic of the Switch at the top of the web page by
simply clicking on a port.
To view this window, click Monitoring > Statistics > Packet Size as shown below:
Figure 11-14 Packet Size window
Click the View Table link to display the information in a table rather than a line graph.
Figure 11-15 RX Size Analysis window (table)
The fields that can be configured or displayed are described below:

 Loading...