xStack® DGS-3120 Series Layer 3 Managed Gigabit Ethernet Switch Web UI Reference Guide
442
Chapter 11 Monitoring
Utilization
Statistics
Mirror
sFlow (RI and EI Mode Only)
Ping Test
Trace Route
Peripheral
Utilization
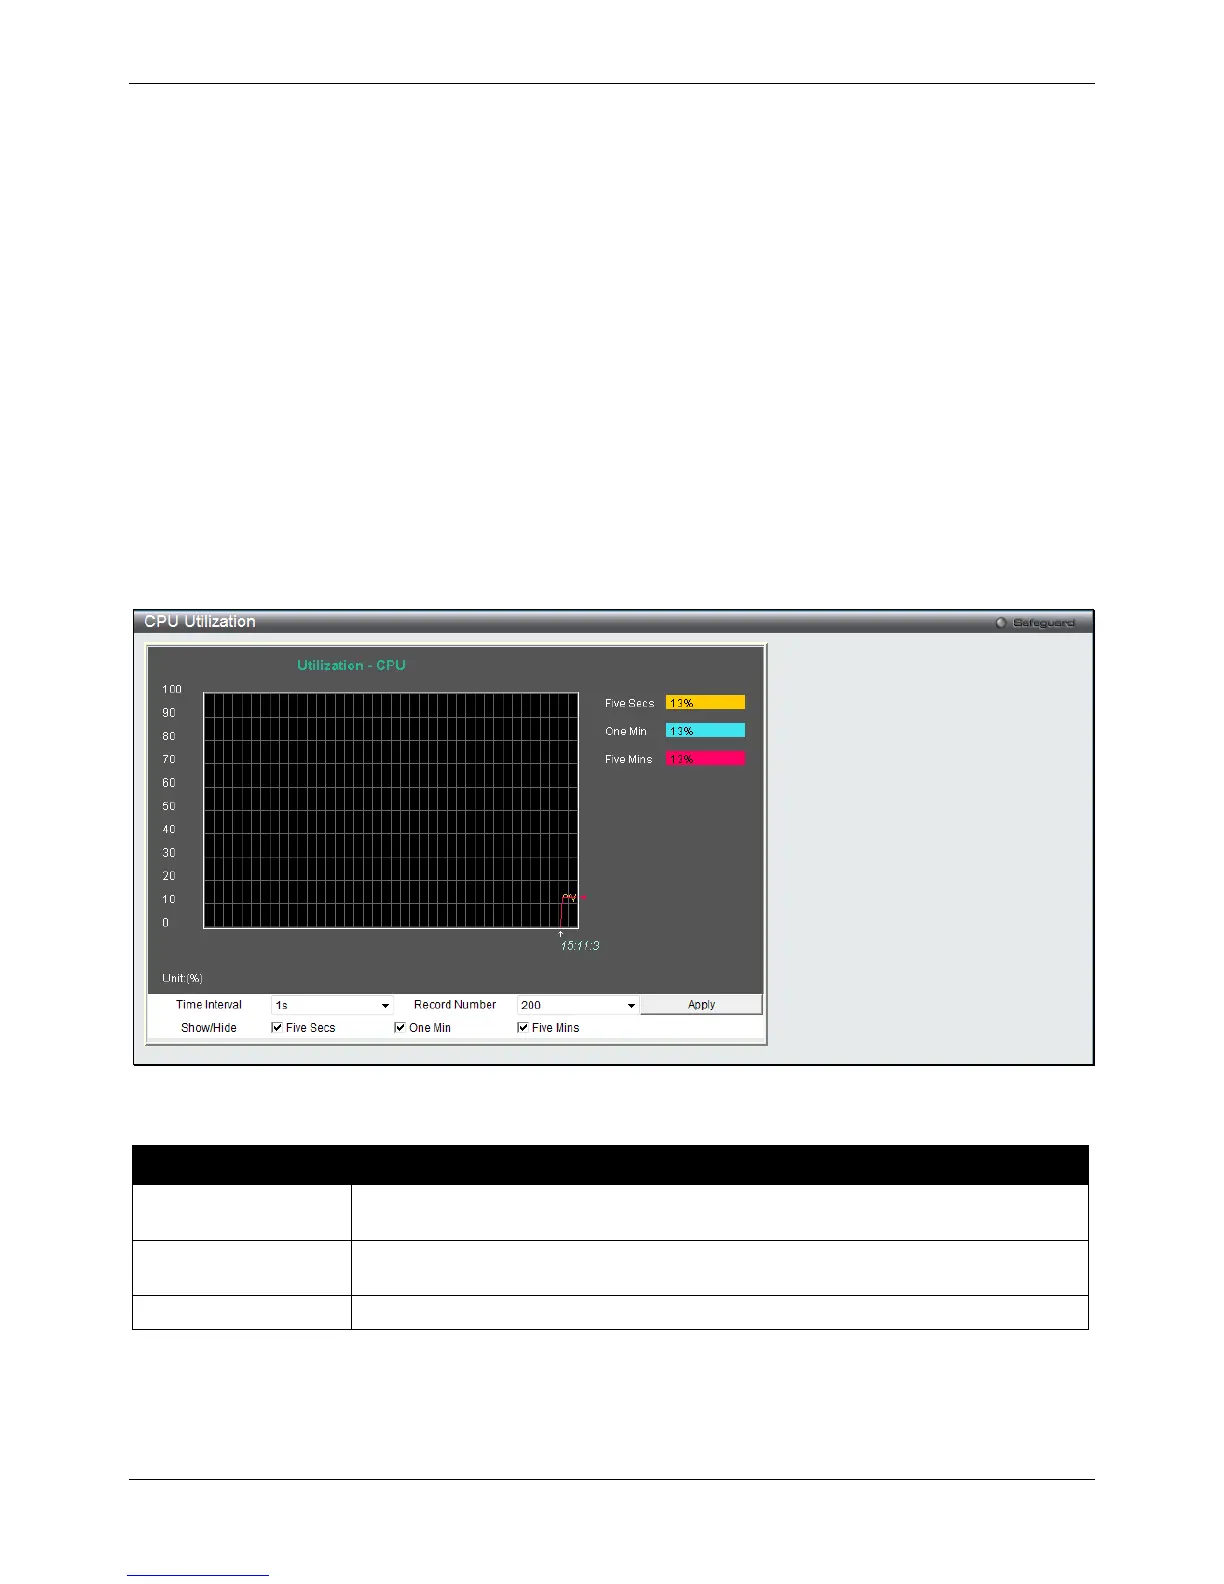
CPU Utilization
Users can display the percentage of the CPU being used, expressed as an integer percentage and calculated as a
simple average by time interval.
To view this window, click Monitoring > Utilization > CPU Utilization as shown below:
Figure 11-1 CPU Utilization window
The fields that can be configured are described below:
Parameter Description
Time Interval Select the desired setting between 1s and 60s, where "s" stands for seconds. The
Click the Apply button to accept the changes made.
DRAM & Flash Utilization
This window is used to view information regarding the DRAM and Flash utilization.

 Loading...