6-23
CH 6/ View Event Data & Reports
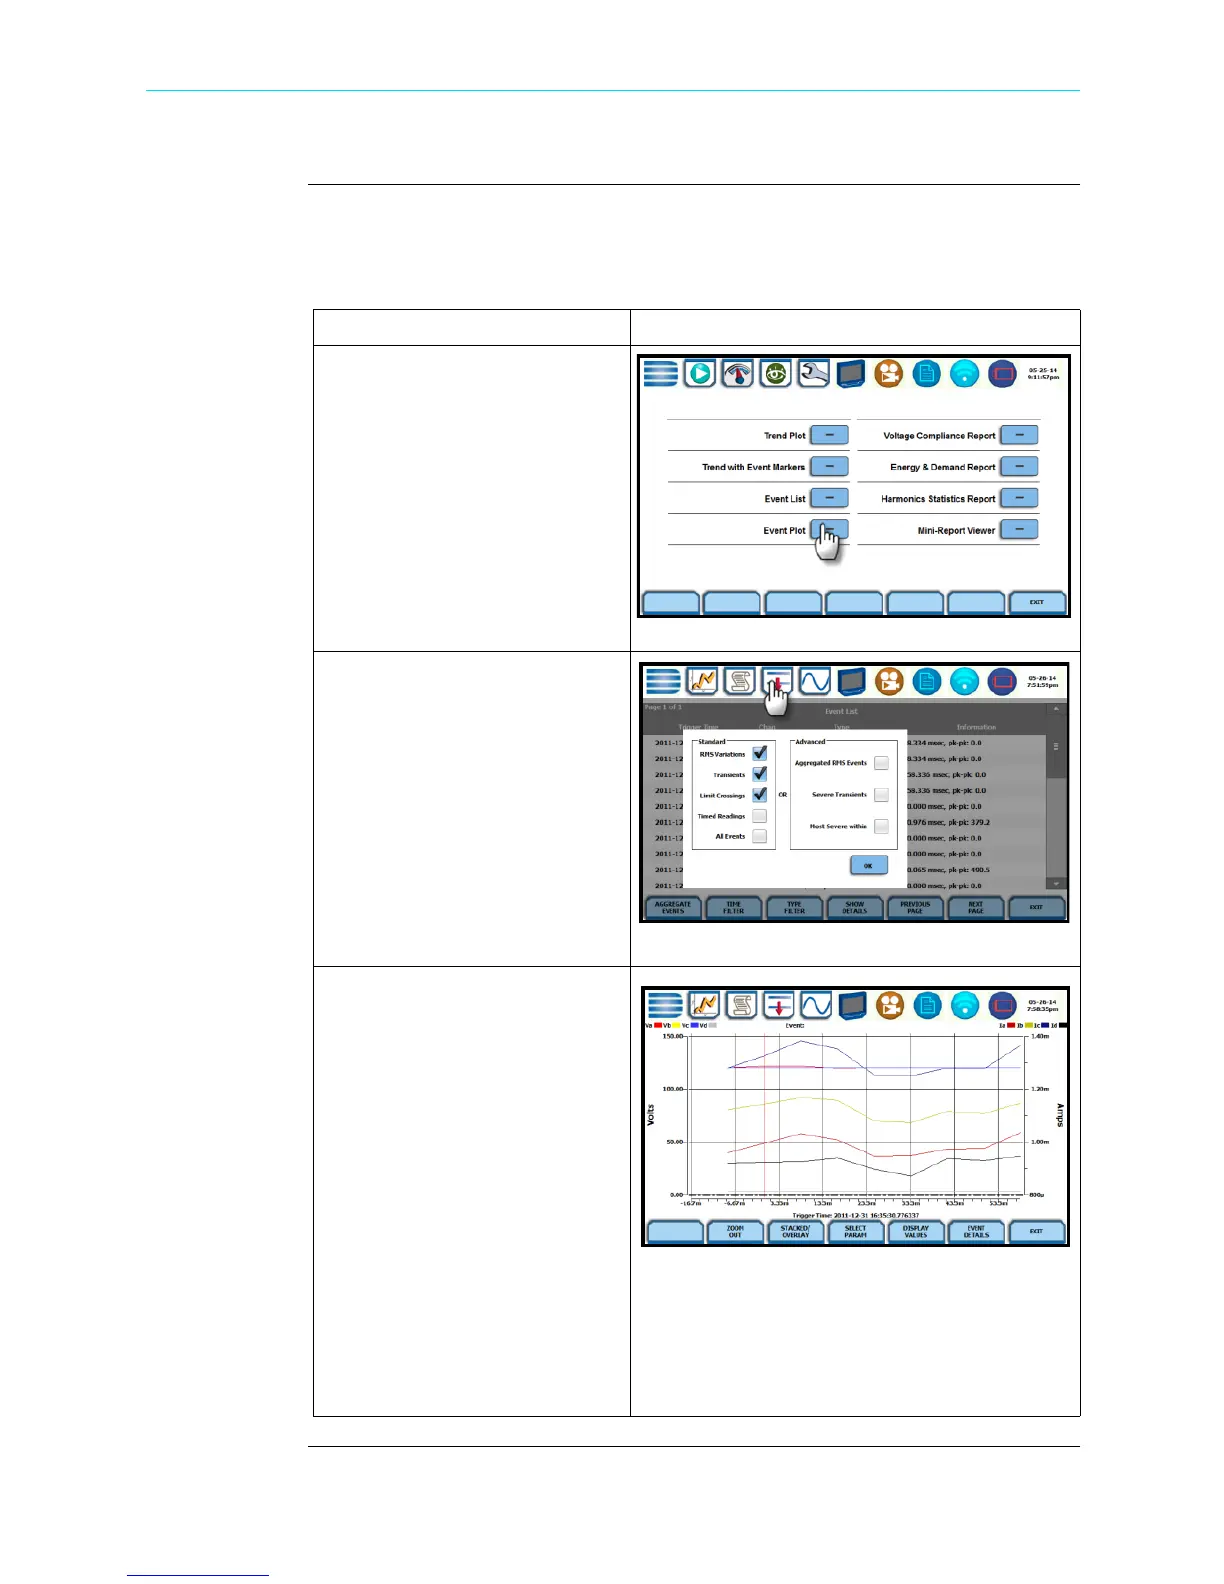
View event plot -
rms
Event plot consists of the rms values during the event for the parameter on display. The
instrument gives you options to change and/or add parameters/channels to plot and
view event details, among others.
Action... Result...
STEP 1: There are two (2) ways
to bring up event plot - rms:
1st: From the Event Data &
Reports menu, press Event Plot.
Proceed to Step 2.
2nd: Event Plot icon is also
accessible on the taskbar of select
event data screens.
Example: You can access Event
Plot from the Event List screen.
STEP 2: Event rms plot displays
actual voltage and/or current rms
that occurred when a certain
threshold parameter was crossed.
The taskbar on Event Plot also
shows the icons to access other
event screens. Use the function
keys at the bottom of the screen to
set up the event plot - rms, as
discussed in the next section.
NOTE: Event plot displays
events in rms by default. To view
event plot in waveform display,
press the Waveform icon on the
taskbar. See section on Event
Waveform.
Horizontal black dotted lines - indicate the
upper and lower limits that trigger events
Red vertical line - indicates the trigger
timestamp or start of event
HDPQ-601
HDPQ-621
HDPQ-631
Shop for Power Metering products online at:
1.877.766.5412
www.PowerMeterStore.com

 Loading...