6-31
CH 6/ View Event Data & Reports
Event waveform
function keys
(continued)
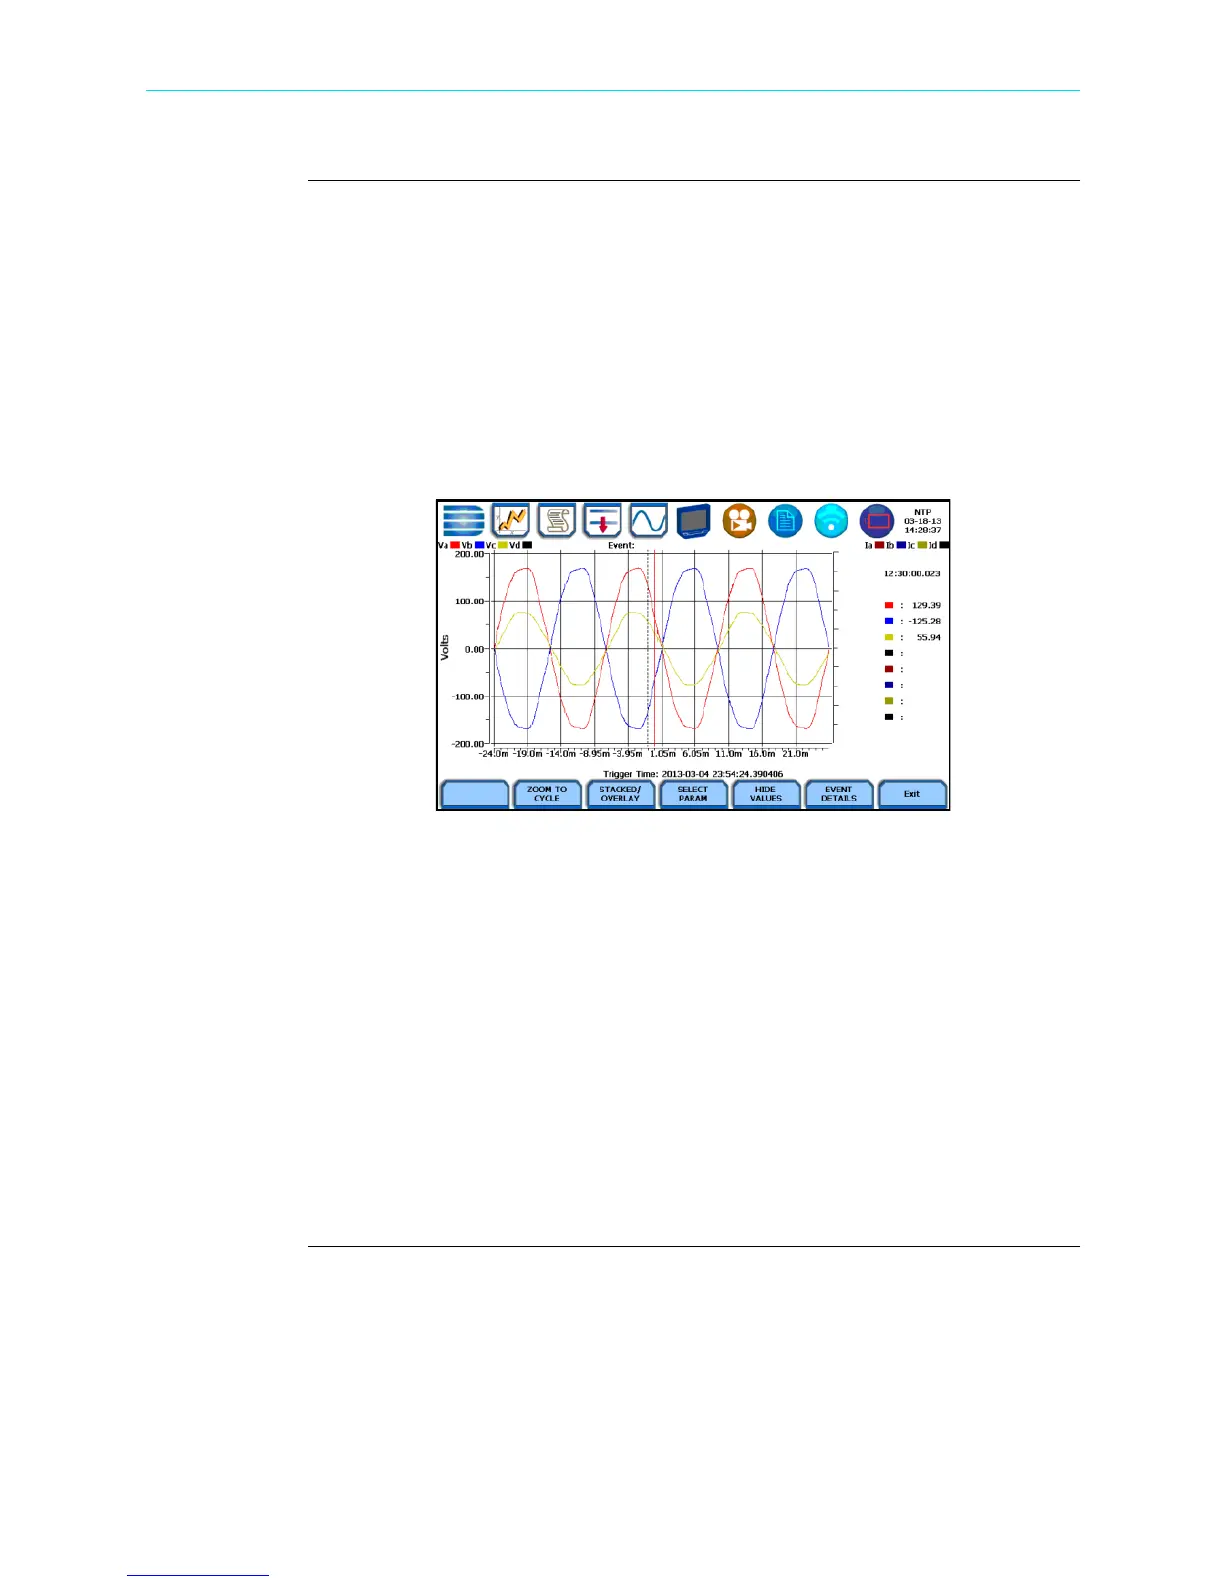
Show Values - splits the screen on the right pane to show values where the vertical
cursor line is displayed. The horizontal black dotted lines indicate the upper and lower
limits that trigger events. The red vertical line indicates the trigger timestamp or start of
event. You can touch and drag the cursor line onscreen and note how values on the right
pane change to show corresponding plot values. A dotted vertical black line appears to
indicate the new point where the numerical data values appear on the plot. The time
range based on which data is plotted appears below the plot display.
The values are identifed by the color coded channel/parameter of captured events on
plot display. If you press repeatedly, this function toggles between hiding/showing data
values.
Event Details - an event detail screen is generated for each event. Event details show
the triggered parameters and event data saved by the instrument, along with
characterization information about the event.
Each event entry is identified by the time and date when the event was captured (shown
on header row), the trigger parameters, and characterization details pertaining to the
selected event entry. The threshold values captured are color coded. Triggered
parameters that are within limits are shown in green. Triggered parameters that are out
of limits, exceeding Low or High threshold limits, are shown in red. Event Details
screen interface is the same for Event Plot - RMS and Waveform.
NOTE: Any wiring configuration, except 2 1/2 Element, monitoring voltage and
current waveforms will include information on Sag Directivity in event details. See
next section.
HDPQ-645
Shop for Power Metering products online at:
1.877.766.5412
www.PowerMeterStore.com

 Loading...