104 UMG70XV3-4EN 12.01.2009
11 Displaying the Measured Values
11.5 Transducer Distance
The optimum transducer distance (here: 51.2 mm) will be displayed in parentheses in the
upper line, followed by the entered transducer distance (here: 50.8 mm).
The optimum transducer distance might change during measurement (e.g. due to tem-
perature fluctuations).
A deviation from the optimum transducer distance (here: -0.4 mm) will be compensated
internally.
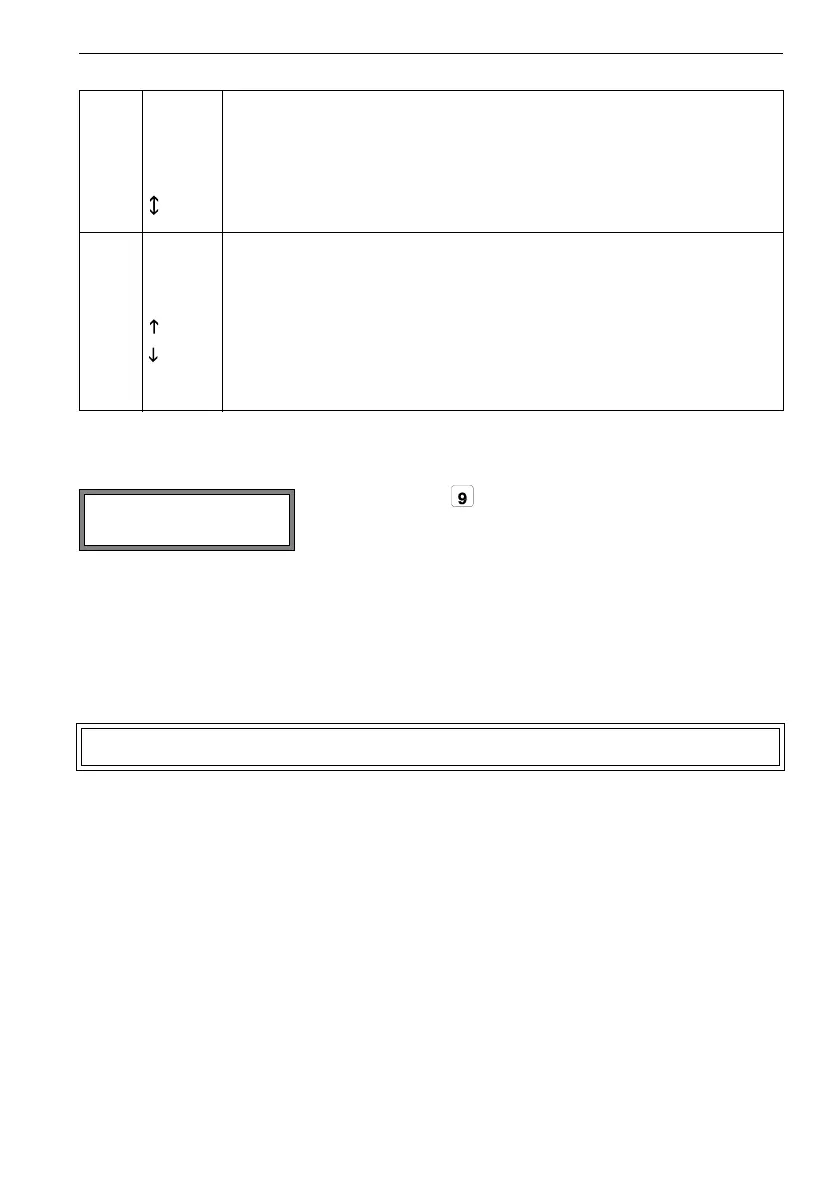
R flow profile
information about the flow profile based on the Reynold's number
T fully turbulent flow profile
L fully laminar flow profile
the flow is in the transition range between laminar and turbulent flow
? unknown, can not be calculated
F flow velocity
comparison of the measured flow velocity with the flow limits of the system
ok, flow velocity is not in a critical range
the flow velocity is higher than the actual limit
the flow velocity is lower than the actual cut-off flow (even if it is not set to zero)
0 the flow velocity is in the offset range of the measuring method
? unknown, can not be measured
By pressing key , it is possible to scroll to the display of
the transducer distance during measurement.
Note! Never change the transducer distance during measurement!
L=(51.2) 50.8 mm
54.5 m3/h
 Loading...
