272 U41117-J-Z125-7-76
History data Global Status
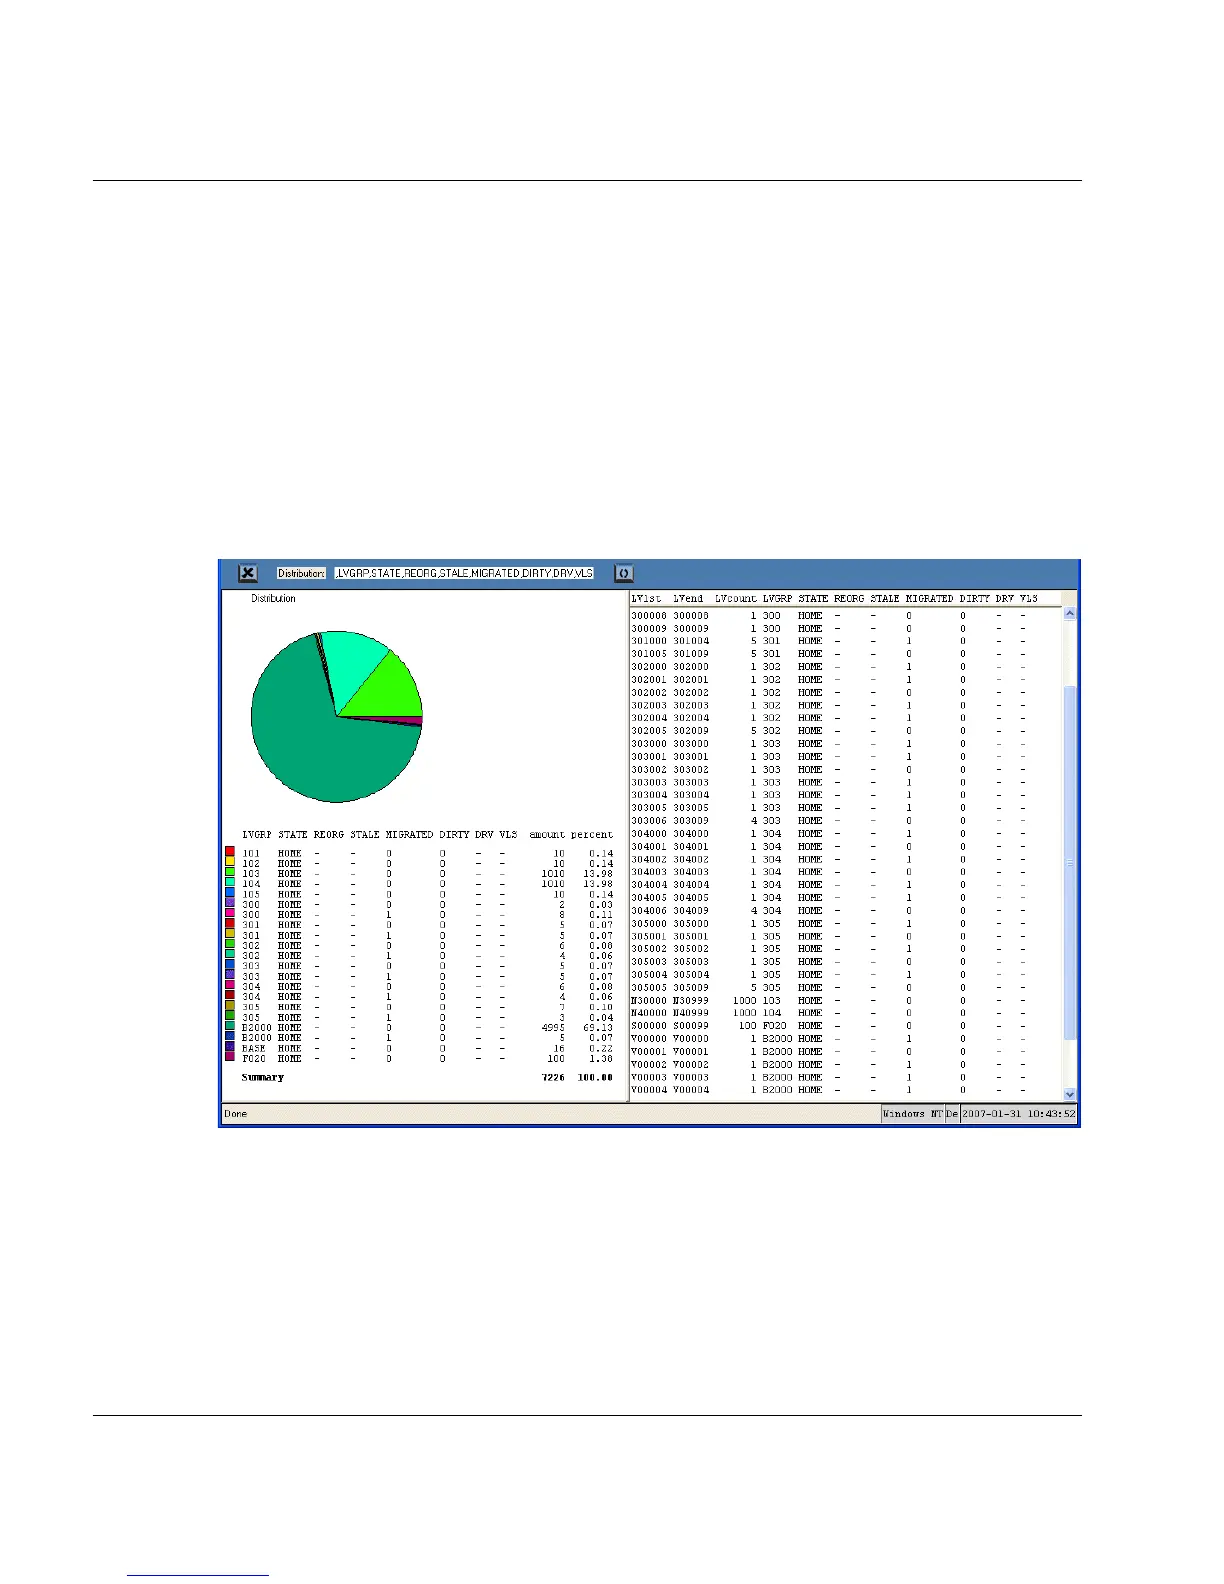
The columns of the distribution table contain the associated values of the distribution para-
meters. The columns containing the number of LVs to which the various distribution para-
meter values relate and their percentage share in the total quantity are also visible.
The pie chart is a graphical presentation of the distribution table.
Clicking on a pie segment or a line in the distribution table highlights the related entries in
the overall data table.
7.6.2.7 Statistics » Logical Components » Logical Volumes (logical view)
After the function has been called, the statistics and the distribution data gathered from the-
se are displayed in a new window:
The right-hand part of the window displays all the output data in tabular form. The left-hand
part of the window shows the distribution data, both in the form of a pie chart and as a dis-
tribution table.