If measurement was started from the Logger Utility
When the recording interval is a value from 10 ms to 500 ms, the instrument’s [Horizontal axis]
setting is limited to a maximum value of 10 s while measurement is in progress. (The limit does
not apply once measurement has stopped.) The refresh interval for the instrument’s waveform
rendering is limited to about once every 5 seconds.
See “9.1 Using the Logger Utility” (p. 235).
2
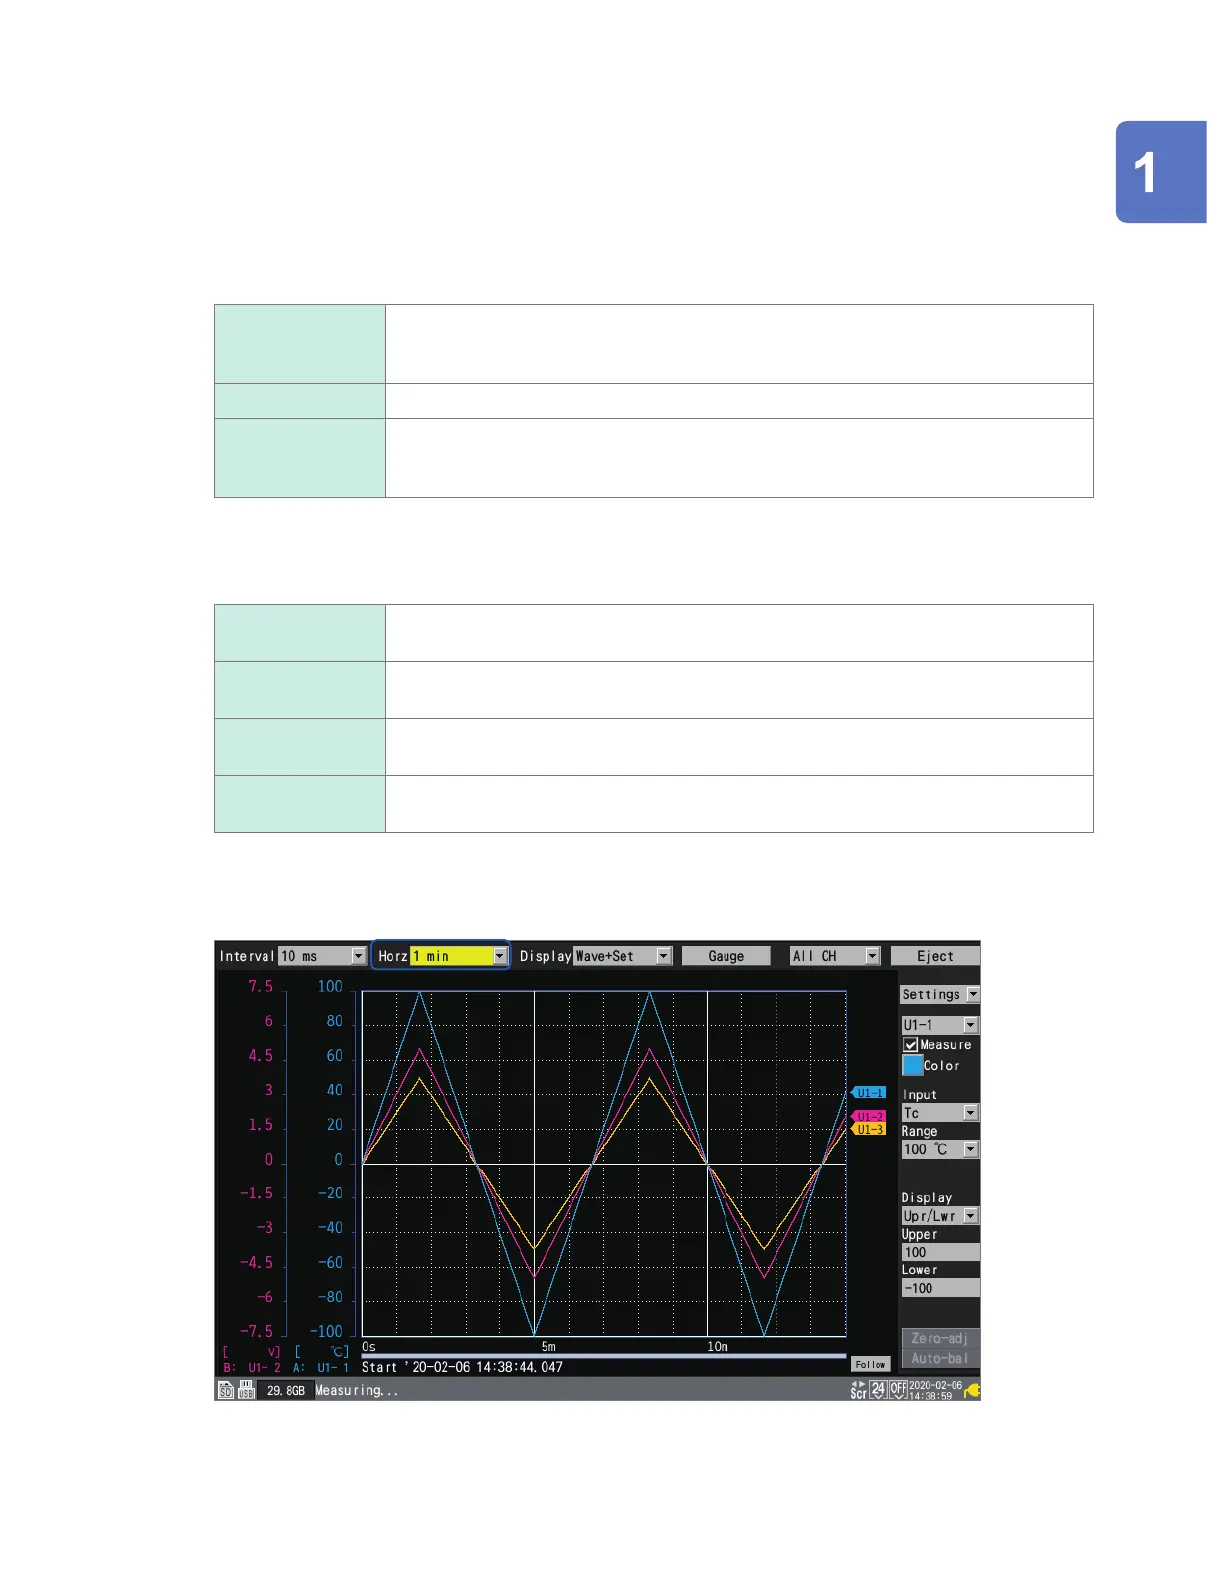
Under [Display horizontal axis], select the display format to use for time values (horizontal-
axis values) displayed on the screen.
Time
Displays the time elapsed since the start of measurement.
When using a trigger, the time elapsed since the trigger activation time will be
displayed.
Date Displays the actual time (date and time) every 10 divisions.
Data points Displays the number of data points since the start of measurement.
When using a trigger, the number of data points from the trigger activation time will be
displayed.
This setting also applies when displaying time values for waveform data saved in the text format.
3
Under [Number display format], select the display format to use for measured values
(vertical-axis values).
Standard
Displays measured values using the same SI prex as the range.
Example: 0.01234V (when using the 1 V range)
Decimal Displays measured values as decimals.
Example: 0.012V (when the number of decimal places is set to 3)
Exponent Displays measured values as exponents.
Example: 1.234E-02V (when the number of decimal places is set to 3)
Prex Displays measured values using an SI prex.
Example: 12.345mV (when the number of decimal places is set to 3)
When setting the horizontal axis on the waveform screen
Under [Horz], you can select the time per division. This setting can be changed while measurement
is in progress.
Settings and Operation
www.GlobalTestSupply.com
Find Quality Products Online at: sales@GlobalTestSupply.com
 Loading...