43
Saving Measured Values
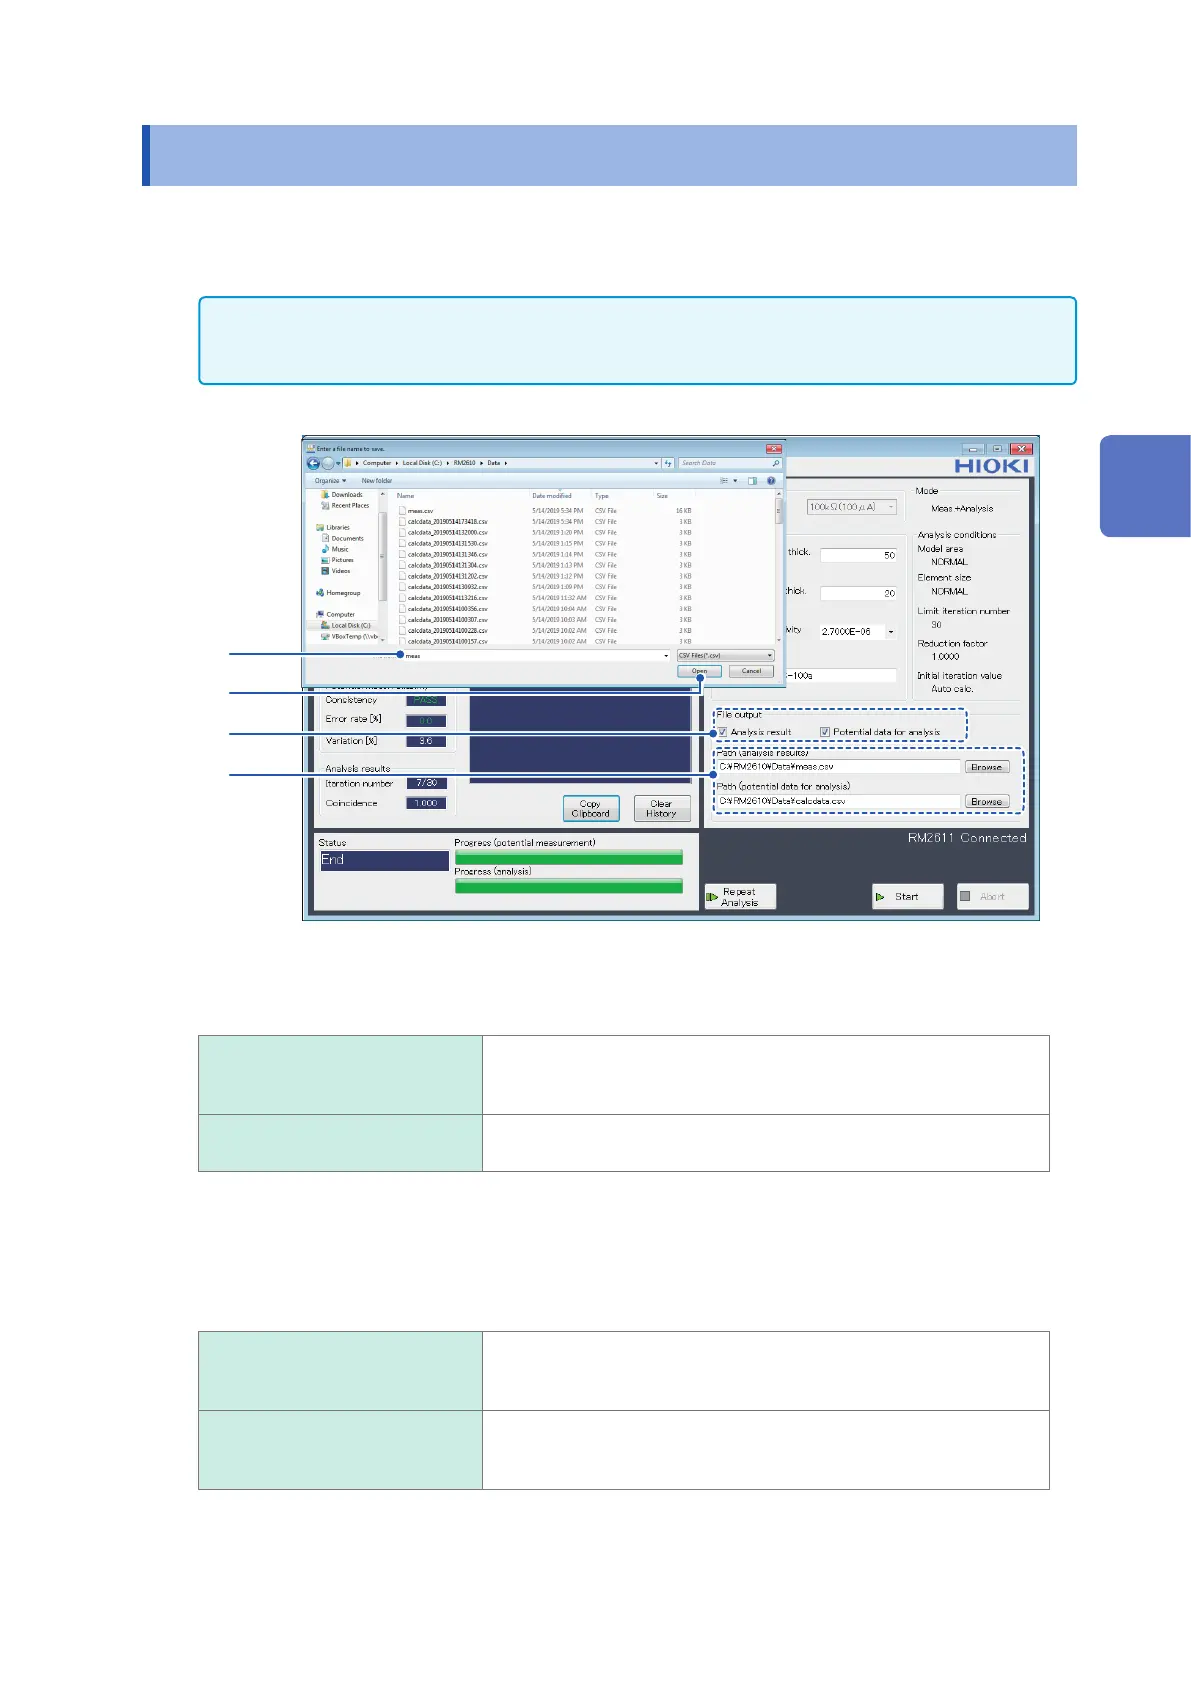
3.6 Saving Measured Values
Measurement results and potential distribution data for analysis are saved in the CSV format. If
you choose the data you wish to output before measurement, a CSV le will be created when
measurement ends.
IMPORTANT
Measurement results will not be saved if you do not choose which data to output. The available settings for
[File output] vary with the operating mode, so check which types of data are available before clicking [Start].
1
2
3
4
1
Choose the type(s) of data you wish to output under [File output] (choose the data you wish
to output to a le).
You can choose multiple types of data.
Analysis result Save composite layer resistivity, interface resistance results, and
measurement conditions. For more information about output file
formats, see “7.3 Output File Formats” (p. 85).
Potential data for analysis Save potential measurement results. The data can then be used in
[Analysis] operating mode (p. 35).
2
Specify the name of the le to which you wish to save the measurement results and click
[Browse].
Specify a folder and le for each data type. Be sure to specify a lename as well as a folder.
For more information about output le formats, see “7.3 Output File Formats” (p. 85).
Path (analysis results) If you specify the name of an existing file, measurement results will
be appended to the file. If you specify the name of a new file, the file
will be created.
Path (potential data for
analysis)
Generate one le for each potential measurement performed. A time
stamp is appended to each lename so that you can differentiate
among results.
3
Enter the name of the lename you wish to use.
4
Click [Open] to save the lename.
3
Basic Measurement