Waveform Measurements
The Waveform Measurement Process
Calculating top and base
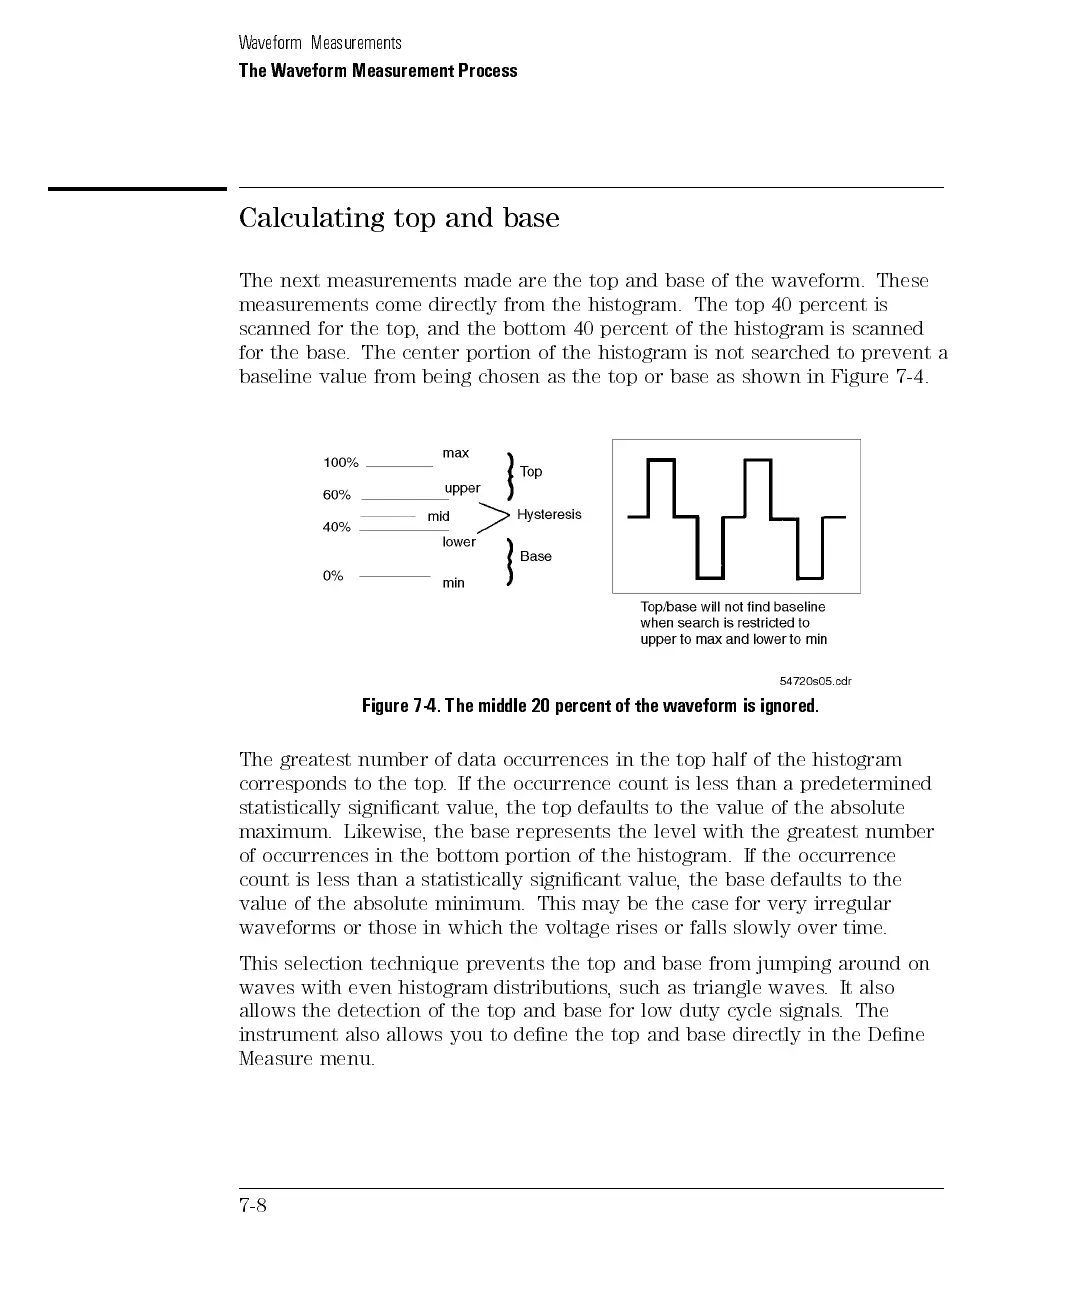
The next measurements made are the top and base of the waveform. These
measurements come directly from the histogram. The top 40 percent is
scanned for the top, and the bottom 40 percent of the histogram is scanned
for the base. The center portion of the histogram is not searched to prevent a
baseline value from being chosen as the top or base as shown in Figure 7-4.
Figure
7-4.
The
middle
20
percent
of the
waveform is
ignored.
The
greatest
number
of
data
occurrences
in
the
top
half
of the
histogram
corresponds
to
the
top
.
If
the
occurrence
count is
less than
a predetermined
statistically
signicant
value
,
the
top
defaults
to
the value
of the
absolute
maximum. Likewise, the base represents the level with the greatest number
of occurrences in the bottom portion of the histogram. If the occurrence
count is less than a statistically signicant value, the base defaults to the
value of the absolute minimum. This may be the case for very irregular
waveforms or those in which the voltage rises or falls slowly over time.
This
selection
technique prevents
the
top
and
base
from
jumping
around
on
waves
with
even histogram
distributions
,
such
as
triangle
waves
.
It
also
allows the detection of the top and base for low duty cycle signals
.The
instrument also allows you to dene the top and base directly in the Dene
Measure menu.
7-8