The General Function Menus
Display Menu
aaaaaaaaaaaaaaaaaaaaaaaaaaaaaaaaaaaaaaaaaaaaaaaaaaaaaaaaaaaaaaaaaaaaa
Color grade...
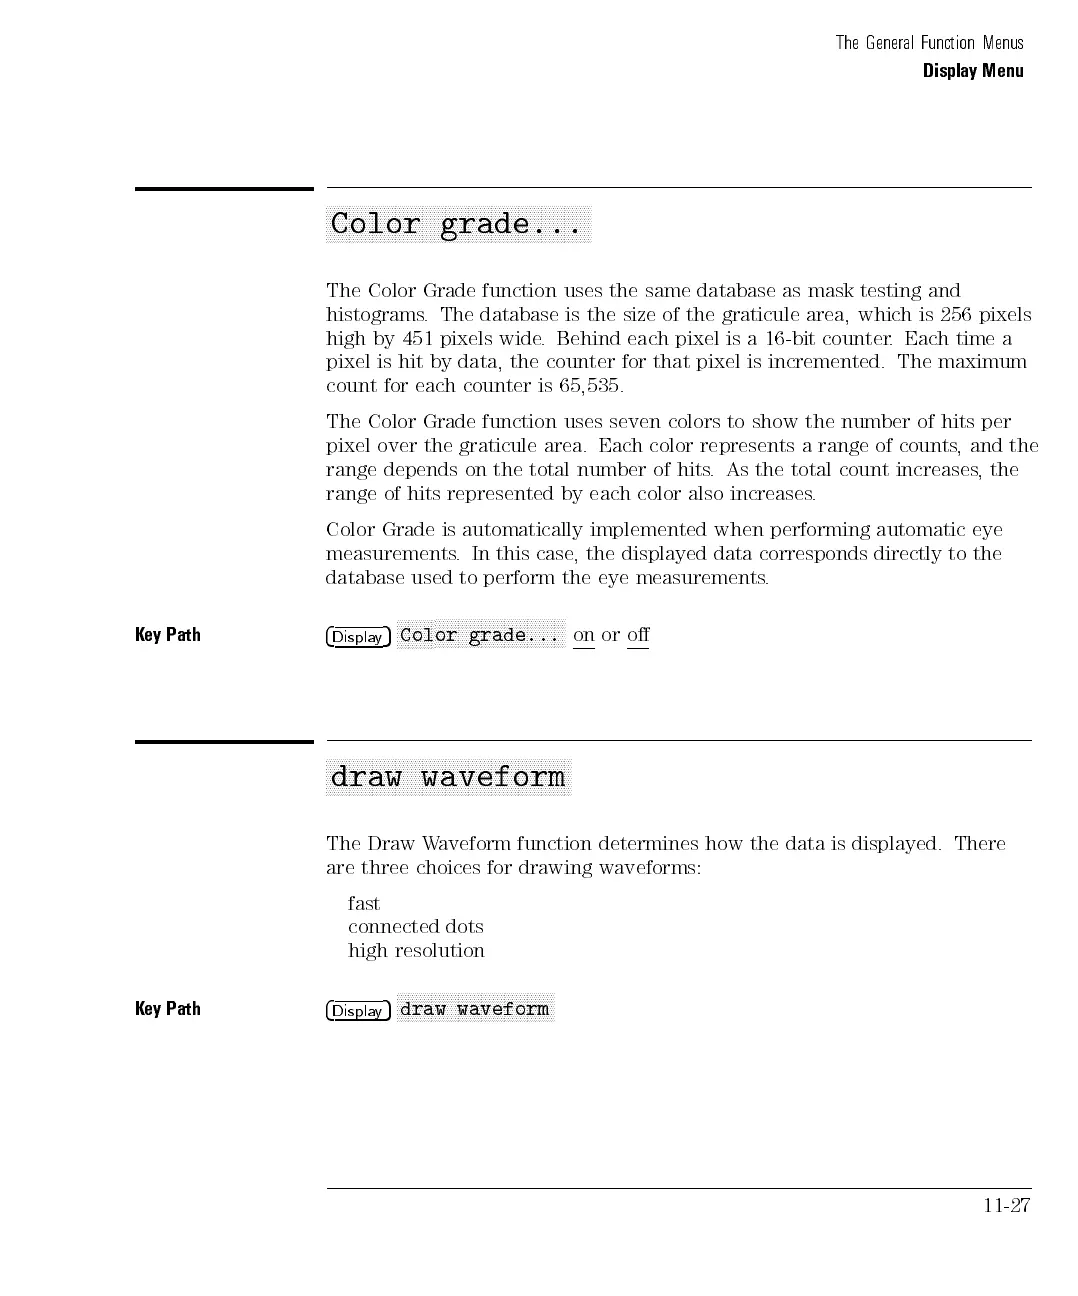
The Color Grade function uses the same database as mask testing and
histograms. The database is the size of the graticule area, which is 256 pixels
high by 451 pixels wide. Behind each pixel is a 16-bit counter. Each time a
pixel is hit by data, the counter for that pixel is incremented. The maximum
count for each counter is 65,535.
The Color Grade function uses seven colors to show the number of hits per
pixel over the graticule area. Each color represents a range of counts, and the
range depends
on the
total
number
of
hits
.
As
the
total
count
increases
,
the
range of
hits represented
by
each
color
also
increases
.
Color Grade
is
automatically
implemented
when
performing
automatic
eye
measurements.
In
this
case
,
the
displayed
data
corresponds
directly
to
the
database used
to
perform
the
eye
measurements
.
K
ey
Path
4
Displa
y
5
N
N
N
N
N
N
N
N
N
N
N
NN
N
N
N
N
N
N
N
N
N
N
N
N
N
N
N
N
N
N
N
N
N
N
N
NN
N
N
N
N
N
N
Color
grade...
on
or
o
a
a
a
a
a
a
a
a
aa
aa
a
a
a
a
a
a
a
a
a
a
a
a
a
a
a
a
a
a
a
a
a
aa
aa
a
a
a
a
a
a
a
a
a
a
a
a
a
a
a
a
a
a
a
a
a
aa
aa
a
a
draw
waveform
The Draw Waveform function determines how the data is displayed. There
are three choices for drawing waveforms:
fast
connected dots
high
resolution
K
ey
Path
4
Displa
y
5
N
NN
N
N
N
N
N
N
N
N
N
N
N
NN
N
N
N
N
N
N
N
N
N
N
NN
N
N
N
N
N
N
N
N
N
N
N
NN
draw
waveform
11-27
 Loading...