2 Line Chart
11-40 WindO/I-NV4 User’s Manual
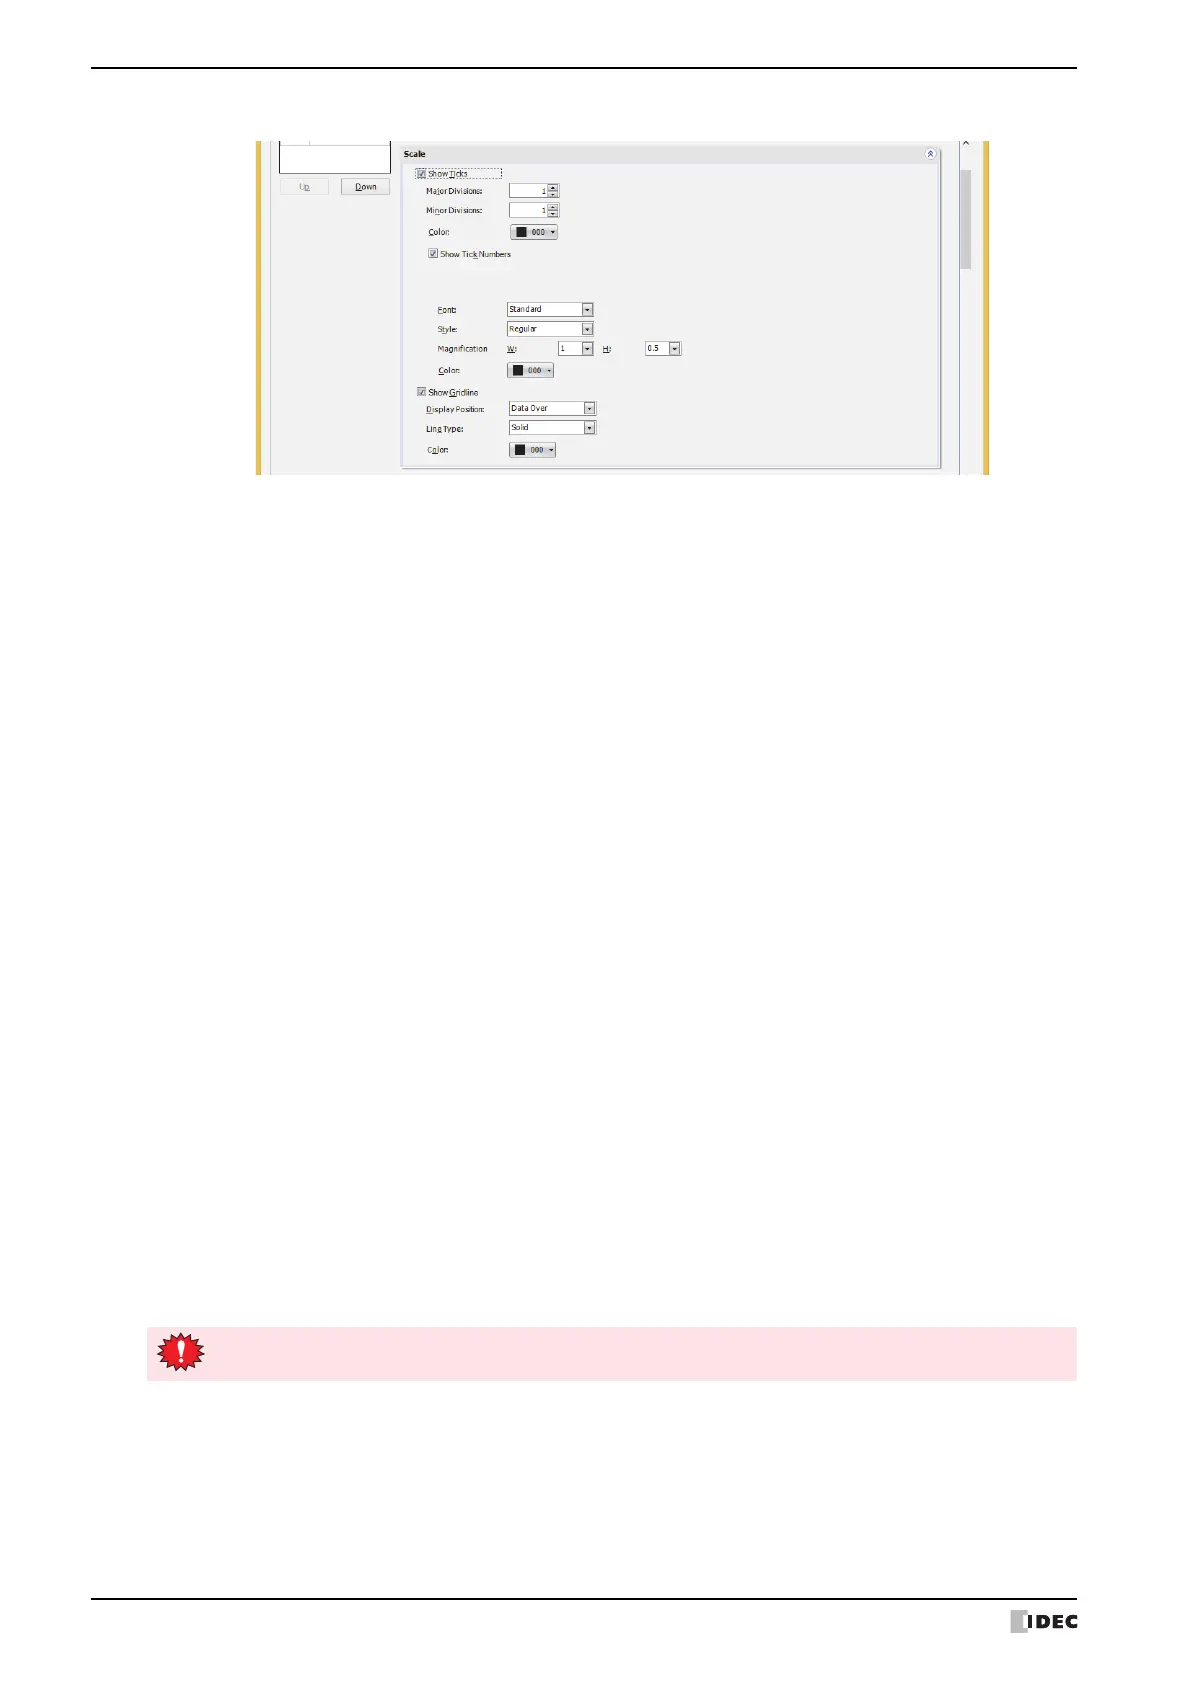
■ Scale Tab
Show Ticks: Select this check box to display a scale on a chart.
Major Divisions: Enter the number of major scale divisions (1 to 20).
Minor Divisions: Enter the number of minor scale divisions (1 to 20).
Color: Selects the color of scales (color: 256 colors, monochrome: 16 shades).
Click Color to display the Color Palette. Select a color from the Color Palette.
Show Tick Numbers: Select this check box to display numbers along the scale. Can only be set for Y-
Axis.
Digits:
Sets the number of digits to be displayed (1 to 10).
Can only be set when Float32(F) is selected for Data
Type under the General tab.
Display Floating Point:
Select this check box to display a floating point along the
scale.
Can only be set when Float32(F) is selected for Data
Type under the General tab.
Floating Digits:
Sets the number of digits for the fractional parts of
numbers (1 to 8) from the number of digits specified for
Digits.
Can only be set when the
Display Floating Point
check
box is selected.
Font:
Selects the font used for displayed text from the following.
Standard, Stroke, 7-Segment
The characters that can be displayed depend on the font.
For details, refer to Chapter 2 “1.2 Available Text” on page
2-6.
Style:
Selects Regular or Bold for the character style to be
displayed.
Can only be set when Standard is selected for Font.
Magnification W, H:
Selects magnification (0.5, 1 to 4, 8) for the displayed text.
Can only be set when Standard is selected for Font.
Size:
Sets character size (8 to 128) for displayed text.
Can only be set when Stroke or 7-Segment is selected
for Font.
Color:
Selects the color of displayed text (color: 256 colors,
monochrome: 16 shades).
Click Color to display the Color Palette. Select a color from the
Color Palette.
If the area for displaying the scale is small, the scale will not be displayed properly.
 Loading...