Affinity
2.0
Additional Information Page 248
Normal and reversed coordinate system buttons enable you to
toggle between reversed and normal graphs.
This may be helpful for counselling purposes since the reversed
curves look more similar to the audiogram and may therefore be
easier for the client to comprehend.
Table view button provides a chart view of the measured and target
values
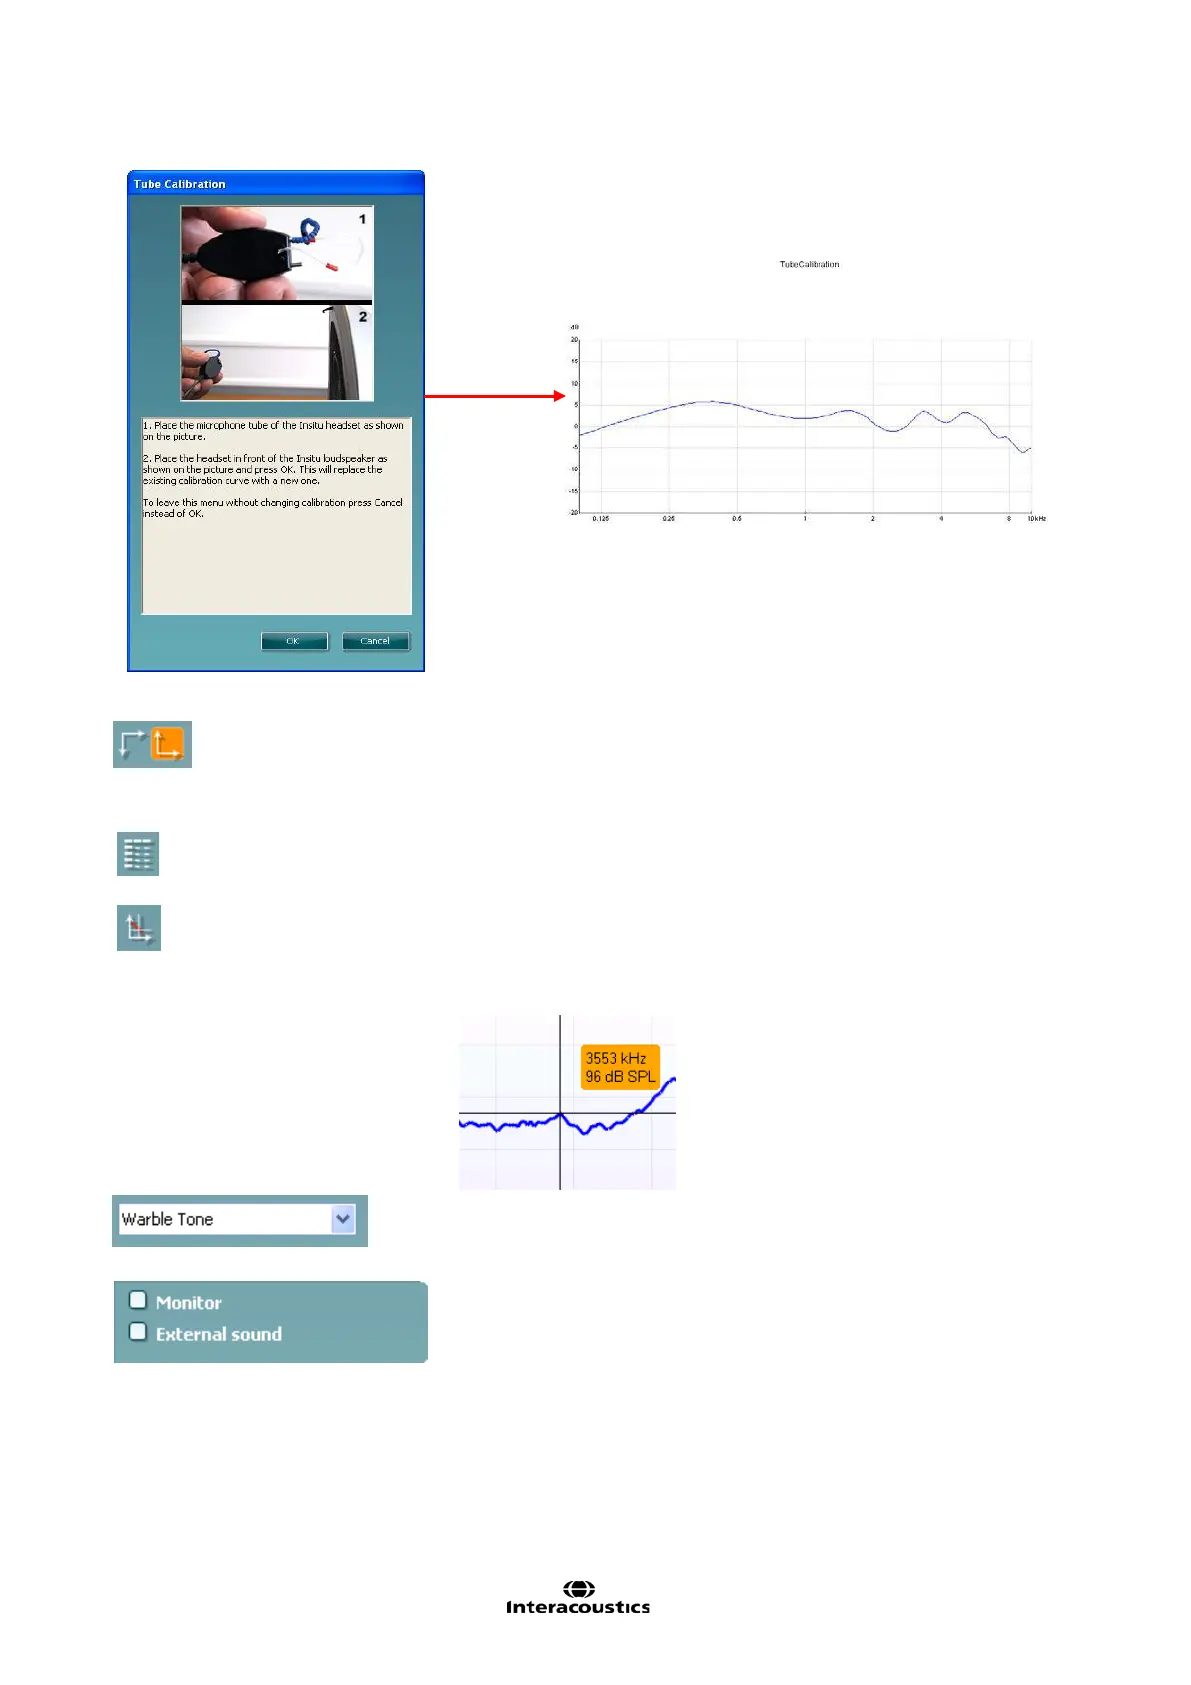
Show cursor on graph provides information about each specific
measured point on the curve. The cursor is “locked” to the curve
together with frequency and intensity label placed at the cursor’s
position, as illustrated below:
Stimulus selection dropdown list allows for selecting the test
stimulus.
Monitor: If you wish to listen to the amplified stimulus through a
monitor.
1. Connect a monitor speaker to the monitor output on the
hardware.
2. Tick the Monitor check box.
3. Use the slider to turn the sound level up and down.