MOOR INSTRUMENTS moorLDI2 RESEARCH USER MANUAL
93
15.4.3
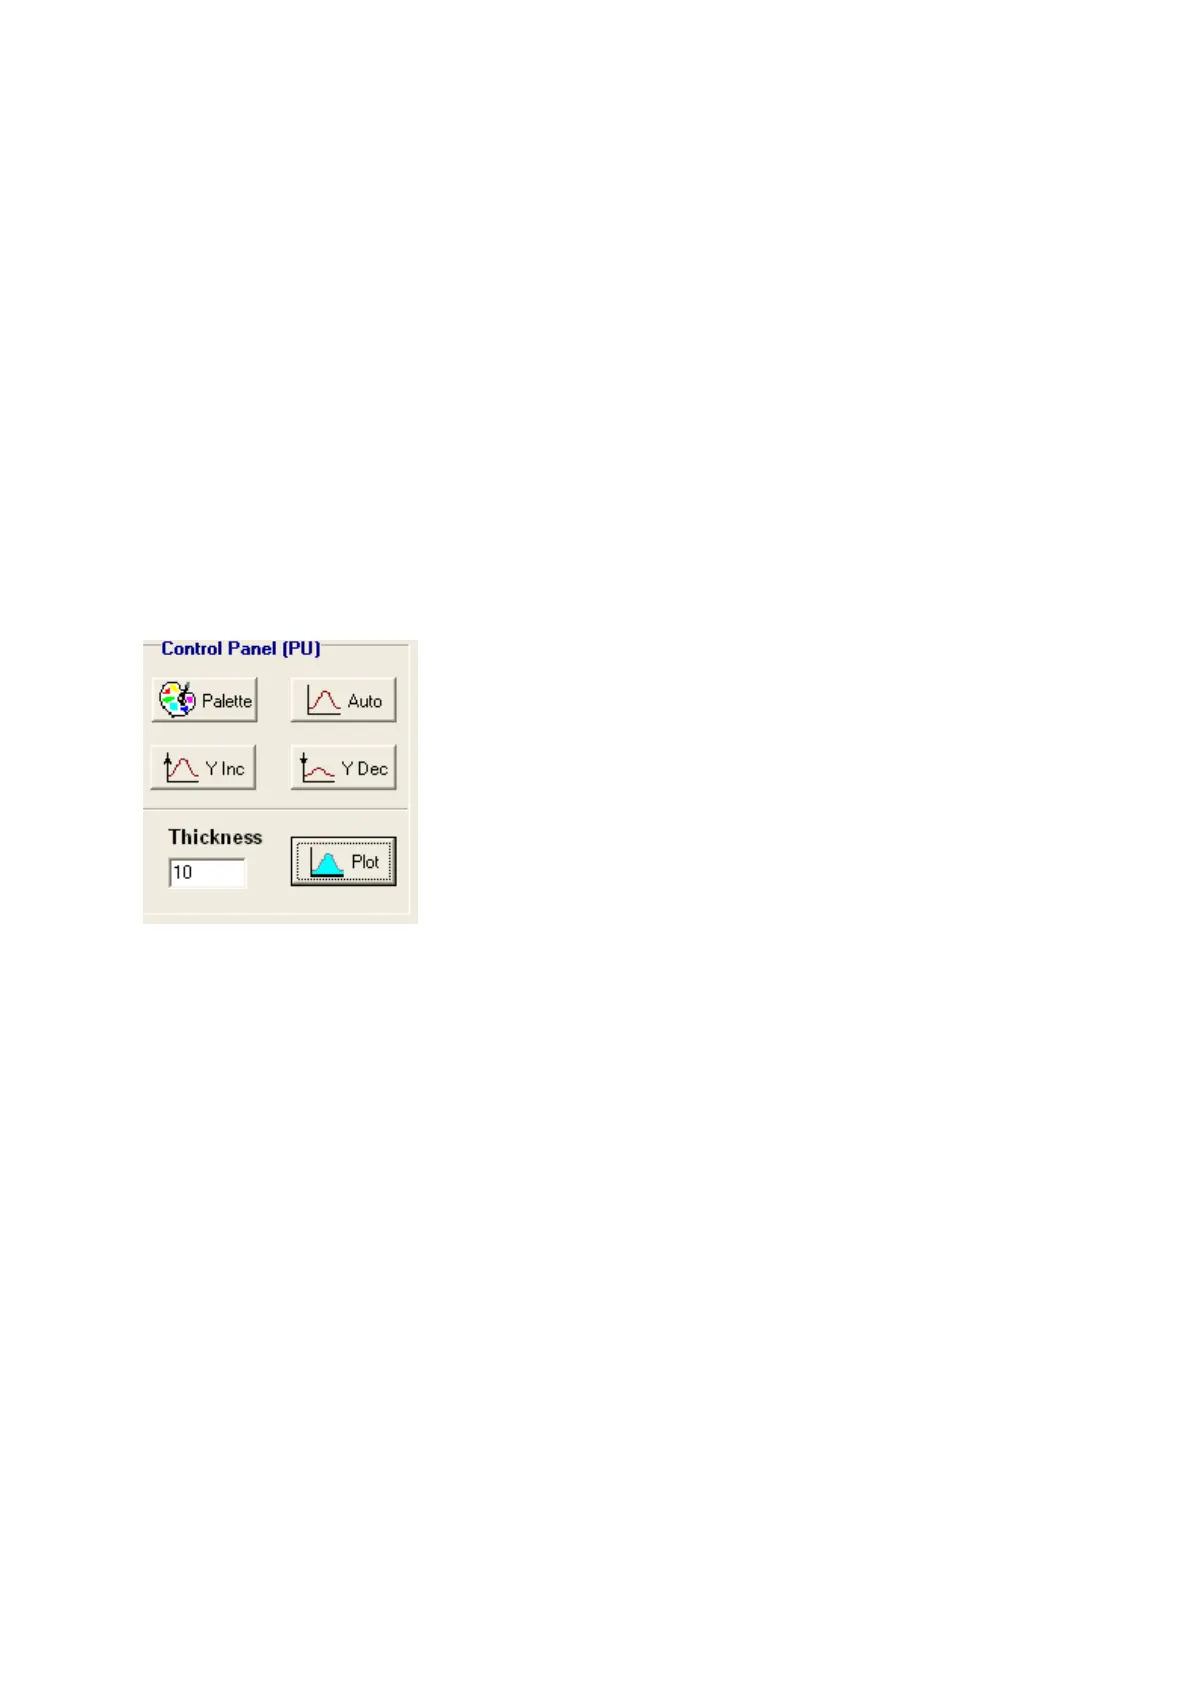
THICKNESS OF PROFILE LINE
Enter the thickness (usually between 2 to 10 ) and click the Plot box to see the new profile graphs.
The default thickness of the profile line is one pixel. This often results in a noisy-looking profile and
the appearance can be improved by increasing the thickness of the line to include pixels adjacent to
the line. This operation is exact when the profile line is vertical or horizontal. The value assigned to
the profile plot is the mean of the pixels perpendicular to the profile line. If the line is at an angle
then the thickness extends either horizontally or vertically depending on whether the line is greater or
less than an angle of 45
o
(pixelunit displacement).
Another way of smoothing the profile plot is to smooth the original image before plotting the profile.
15.4.4 PROFILE AMPLITUDE
The profile amplitude on the y-axis can be increased or decreased clicking the Y Inc or Y Dec boxes
in the Control Panel. Auto will automaticall scale the plots and the Palette option will produce plot
scale directly related to the palette scales.
15.4.5 PROFILE FILE SAVE, APPEND AND PRINT
F
ile
S
ave
A
ppend
P
rint
E
xit
Information
S
aved from Profile analysis is stored in a *.PRO ASCII file and contain information as
shown below. Note that if the line makes an angle equal to or less than 45
0
to the X axis of the image
the X values are displayed in the Profile Plots. If the angle is greater than 45
0
then thr Y values of the
pixel positions on the Profile line are plotted.