MOOR INSTRUMENTS moorLDI2 RESEARCH USER MANUAL
87
15. IMAGE ANALYSIS
15.1 INTRODUCTION
To analyse a either a whole image or sections of an image or equivalent parts of each image within a
repeat scan set, it is first necessary to load the image(s) onto screen:
Click the open file icon
Select file and open
15.1.1 TYPES OF IMAGE ANALYSIS
There are three types of analysis that can be performed:
Statistics
Histogram
Profile
Before these can be applied it is first necessary to define a region of interest (ROI).
(For ROI refer to Section 13).
N.B. a small ROI can be defined after zooming a box ROI.
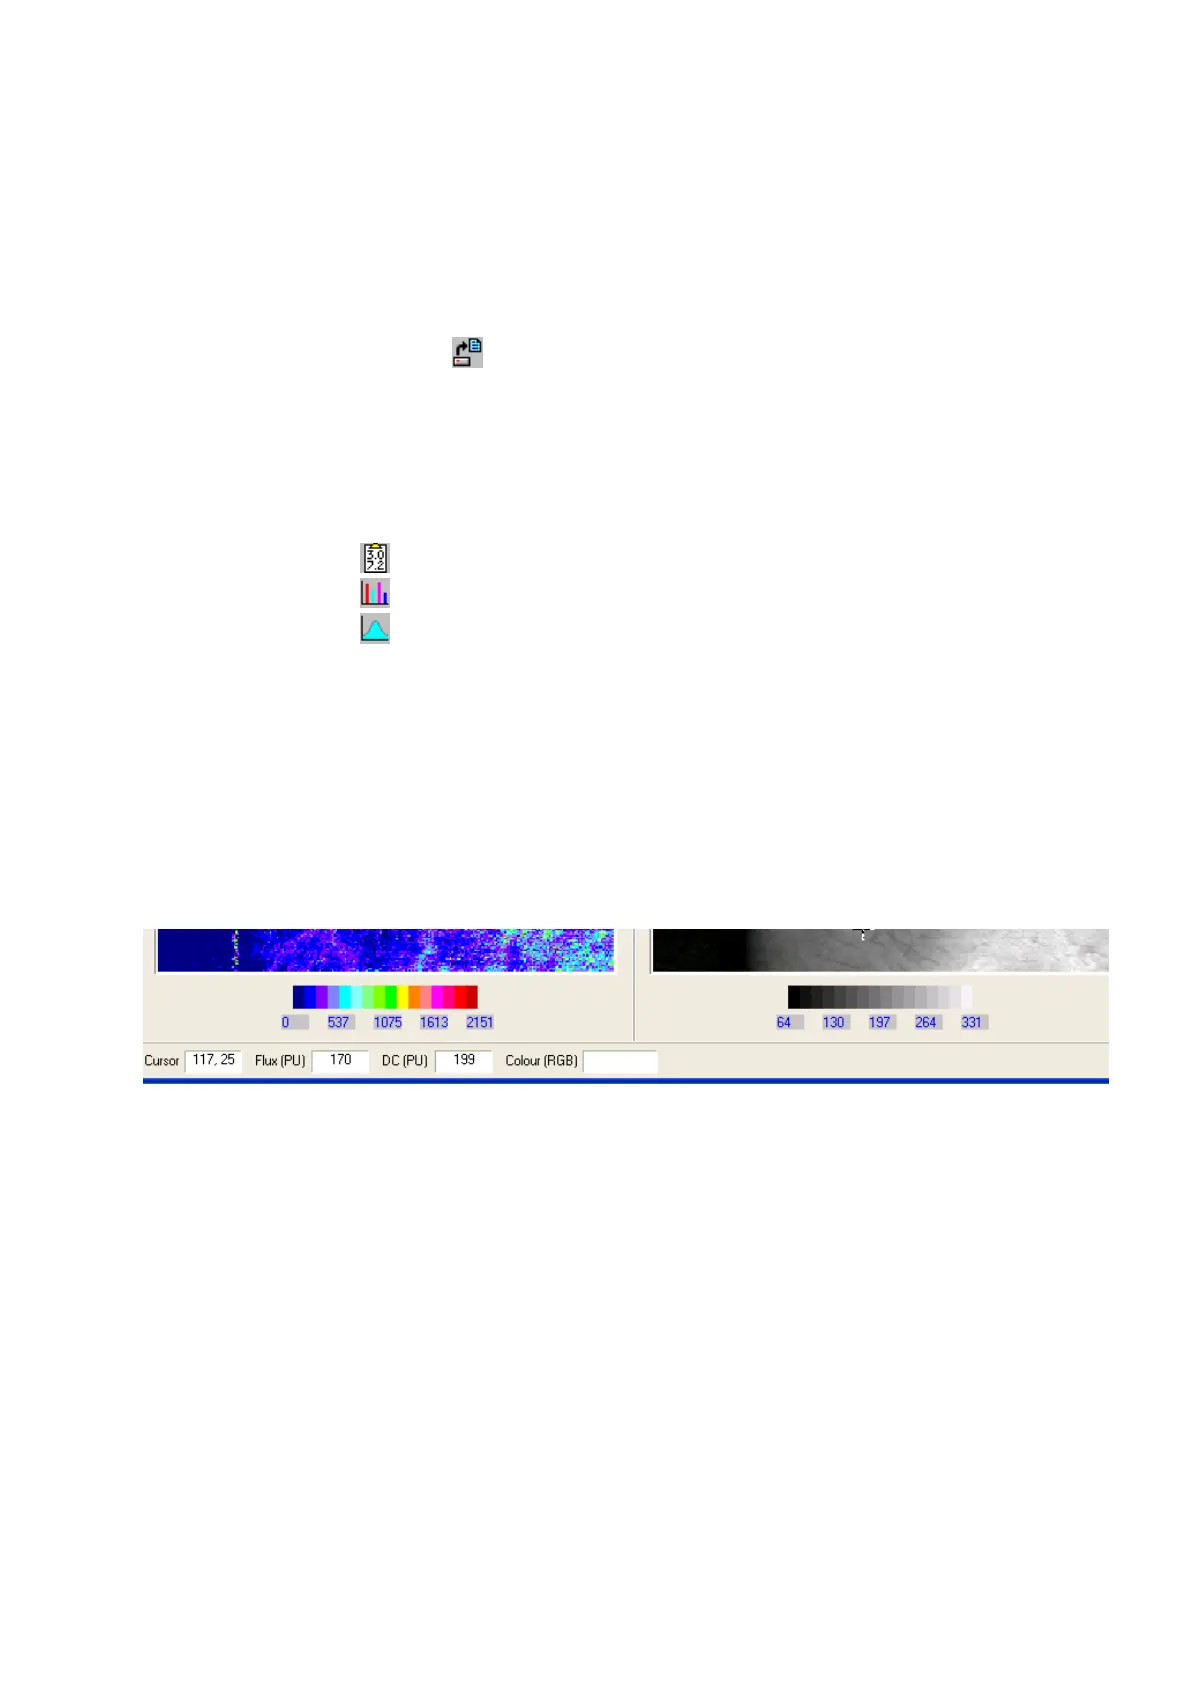
15.1.2 PIXEL VALUES
By moving the cursor over the image, the flux and dc values at the cursor position are displayed in
boxes below the image window.
N.B. images can be displayed in RU (relative units) or PU (perfusion units). See Section 10.4 for RU,
PU definitions. RU and PU display can be toggled with the RU/PU icon. In the above example values
are displayed in PU units.